Understanding Log Management and Analysis Tools for Linux Systems
0 min read

This guide is a beginner-friendly dive into linux log analysis tools. We’ll start with the basic commands you can run right now and work our way up to the professional linux log management strategies used to keep giant networks running smoothly.
What Is a Log File?
A log file is a computer-generated data file that contains information about usage patterns, activities, and operations within an operating system, application, server, or device. A log file is always the primary data source for network observability. Multiple log files represent a historical record of everything and anything that happens within a system, showing events that can reveal whether resources are performing correctly or running with flaws. These events can be transactions, errors, and intrusions. The data transmitted from log files can be sent in structured, semi-structured, and unstructured formats.
How the Linux Logging Pipeline Works
To truly master linux log analysis, you have to understand that logs don’t just appear in a folder; they move through a specific pipeline. Modern Linux systems rely on a "relay" of different services to handle data.
Understanding this flow is what allows you to troubleshoot effectively, as different issues require looking at different parts of the pipeline:
-
systemd-journald (The Collector): This is the first responder. It captures data directly from the kernel and applications the moment they happen. It stores logs in a fast, binary format. Because it's binary, you can't open it with a text editor; you must use the
journalctlcommand to read it. -
rsyslog (The Processor): Most systems then pass that data to
rsyslog. Think of this as the post office. It takes the raw information and "routes" it. It decides that an ssh login should go toauth.log, while a general system error should go tosyslog. - syslog (The Standard): This is the actual protocol or "language" the logs are written in. It ensures that whether a message comes from a web server or a database, it follows a consistent format so that your linux log analysis tools can parse it without breaking
Where Do Log Files Come From?
Log files are automatically computer-generated whenever an event with a specific classification takes place on a network. These events could involve apps, containers, databases, firewalls, endpoints, IoT devices, servers, web services, other networks, etc. Much of the infrastructure that we use daily produces log files.
Linux Log Files: What You’re Actually Looking At
Linux doesn’t lack logs. It drowns you in them. The issue isn’t access, it’s knowing which ones matter when something breaks or starts behaving off.
Most logs fall into a few buckets. The categories aren’t strict, but they’re close enough for triage.
Quick Breakdown
-
Application logs
Track how apps behave. Errors, warnings, failed requests. Usually, the first place you look when something user-facing breaks. -
Event logs
Record system-level activity. Good for building a timeline when you’re piecing together what happened. -
Service logs
Background processes, no UI, just output. If a daemon dies or restarts in a loop, it shows up here. -
System logs
Kernel and OS-level events. Hardware changes, boot issues, low-level failures.
What That Looks Like in Practice
|
Log Type |
Example Path |
What You’ll See |
When It Matters |
|
Application |
|
HTTP errors, request failures |
Web app issues, outages |
|
Event |
|
General system activity |
Timeline reconstruction |
|
Service |
|
Login attempts, auth failures |
Suspicious access, brute force |
|
System |
|
Kernel messages, hardware signals |
Boot errors, device problems |
You don’t read all the logs. You pivot between them.
Who Uses Log Files?
Many professionals within the technology sector utilize log files in their daily work for valuable insights. For instance, information technology operation teams use log files to identify infrastructure balance, manage workloads, reduce cost and risk, maintain uptime, and ensure business continuity. Another example is developer operation teams using log files to detect critical application errors and identify areas to optimize application performance. Even code developers use application logs to help them understand and measure how applications behave during development and before release. These examples show how critical knowledge of log file analysis tools and techniques is within the industry.
The 5-Step Log Analysis Process
Log analysis is the process of reviewing and understanding logs to determine potential issues. A standard linux log management workflow follows these five steps:
- Instrument and Collect: Installing a collector to gather data from any part of the stack.
- Centralize and Index: Integrating data into a centralized platform to make it searchable.
- Search and Analyze: Using pattern recognition, normalization, tagging, and correlation to find insights.
- Monitor and Alert: Implementing real-time, automated monitoring that triggers alerts when specific conditions are met.
- Report and Dashboard: Visualizing data through streamlined reports for quick stakeholder review.
Getting Started with Log Analysis
Before downloading linux log management and analysis software, novice users should familiarize themselves with linux log analysis through the command line. While /var/log remains the traditional home for logs, most modern Linux distributions (Ubuntu, Fedora, Debian) now use systemd-journald. To view these logs, you’ll use the journalctl command.
However, many files are still stored in plain text. Users can find many logs of a Linux system by running the following command on the terminal:
ls /var/logDoing so will reveal file names such as syslog, messages, auth.log, secure, cron, kern.log, etc. The syslog or messages file contains general information that logs activities across the system. File names such as auth.log or secure specifically store authentication logs. cron (a clock daemon) stores cron job-related messages, such as cron initiations and failures. The file name kern is for used kernel logs and related warning messages. User applications such as Apache2 and MySQL can also store their logs in this directory.
What Do Log File Entries Look Like?
By default, log file entries are in a format close to this: Timestamp, Hostname, Application name, Priority, Message
Most logs follow a standard pattern, so you can read them quickly. Think of it like a "Who, What, Where, and When" for your server. A typical entry includes:
- Timestamp: Exactly when it happened.
- Hostname: Which server reported it.
- Application: Which program was running.
- Priority: How bad the situation is (e.g., info vs. critical).
- Message: The actual details of the event.
For example, if someone tries to hack your system using the "root" account, the log entry looks like a single string of text:
May 11 20:04:33 main_server sshd[41458] Failed password for root from 192.168.0.3 port 22 ssh
How to Use Linux Logging to Troubleshoot a Failed Service
Instead of just guessing which file to open, follow this standard workflow used by system administrators:
1. Check the Live "Flight Recorder." If a service like Apache or Nginx just crashed, start with the journal. It’s the most direct route to the error. journalctl -u apache2.service Why: This pulls data straight from systemd-journald before it even hits a text file.
2. Trace the Historical Files. If the issue happened yesterday, the journal might have rotated out, or you might need more context from the system as a whole. grep "error" /var/log/syslog
Why: This searches the text files generated by rsyslog. It’s better for long-term forensics.
3. Monitor in Real-Time. If you are trying to recreate the bug, watch the logs as you trigger the error. tail -f /var/log/apache2/error.log Why: This lets you see the "post-processed" logs from rsyslog the second they are written to disk.
By understanding this relay—from the journald collector to the rsyslog processor—you stop guessing where logs live and start navigating the system like a pro. Using the right linux log management tool for the right stage of the pipeline is what makes your troubleshooting actionable.
Linux Command Line Tools for Log Analysis
There are a lot of advanced log analysis tools available, but we’ll focus on command-line tools first. The most common Linux utilities to analyze Linux logs are grep, awk, sed, tail, cut, and wc.
grep
Grep is a search tool for searching inside documents based on plain text or regular expression patterns. Searching for regular expressions for log analysis can reduce false positives and provide a more accurate search. For example, this command searches for lines in the log file that contain IP addresses within the 192.168.25.0/24 subnet:
grep -E "192\.168\.0\.\d{1,3}" /var/log/syslogHere the -E option is used to specify a regular expression pattern to search for. Users can also utilize the inverse search to rule out certain lines. This command searches for all lines that do not contain IP addresses within the 192.168.25.0/24 subnet:
grep -v -E "192\.168\.0\.\d{1,3}" /var/log/syslogThese expressions are helpful in use cases such as scenarios where users look for the timestamps, IP addresses, and hostnames of logs that indicate suspicious behavior.
awk
Awk is a powerful text-processing language wrapped into a command-line utility tool. It can filter and parse log files efficiently, making it a powerful utility with many different options. Suppose that this is the format of a log file, for instance, and you want to extract all the usernames that have had a failed password attempt:
May 11 20:04:33 main_server sshd[41458] Failed password for root from 192.168.0.3 port 22 ssh
To extract the username, users can run this command:
awk "/.*Failed password.*/ { print $8 }" /var/log/auth.logThis command would print out the username root. The line “/.*Failed password.*/ finds the lines that contain the string “Failed password, and “{ print $8 } tells awk to print out the eighth field of the line. These expressions are helpful in use cases where there are many failed passwords from a single username, an indicator of a brute force attack.
sed
Short for stream editor, sed can read an input file and modify the input as specified by a list of commands. Here’s an example of how to use sed:
sed "s/May 11//g" /var/log/auth.log > newfile.txtFor contextual purposes, the ‘s’ symbol in sed stands for search, while the ‘g’ symbol stands for copy and append. The command above will search for lines that contain the string ‘May 11’ and append all of the contents of those lines found into a new file called newfile.txt. A great use case for this command is if a user needs to see logs from that day precisely.
tail
Users should use the tail command to see the tail end or the last couple of file lines:
tail /var/log/auth.logThe default behavior of this command is to output the last ten lines of a file to standard output. However, using tail with the -f flag instructs tail not to stop at the end of the file and to wait for additional data to be appended to the input.
tail -f /var/log/auth.logA use-case for the command above will be checking if a server is running correctly by looking through the tail of its auth.log file. The user should include ‘-f’ for this specific scenario to get the most current log information.
cut
A command-line utility that cuts and parses files according to a delimiter, cut is perfect for analyzing delimited log files. This command parses the output of the who command to show the names of the users currently logged into the system:
who | cut -c 1-16This command utility is a perfect tool to help make files easier to read.
wc
This command-line utility displays the number of lines, words, and bytes contained in each input file. What’s cool about wc is that users can pipe the output of some of the above commands. For example, this command counts the times the IP address 111.14.39.220 was logged:
grep -E "192\.168\.0\.3" /var/log/syslog | wc -lThis can be useful for understanding where log-ins are coming from on a server.
Searching with Log Management Systems
One big problem with command-line tools is that they don’t scale well to large files or across multiple systems. A fix is for users to start searching with linux log management systems. An advantage of using log management in linux is that it can simplify analyzing and searching extensive collections of log files. For instance, they can automatically parse standard log formats like syslog events, SSH logs, and web server logs.
Advanced users may eventually look toward a Linux SIEM (Security Information and Event Management) approach. Another advantage over command-line tools – grep in particular – that some log management tools utilize is query languages such as Apache Lucene, which provide more flexible searches and an easier search syntax than regular expressions.
Recommended Open Source Log Monitoring and Management Tools for Linux
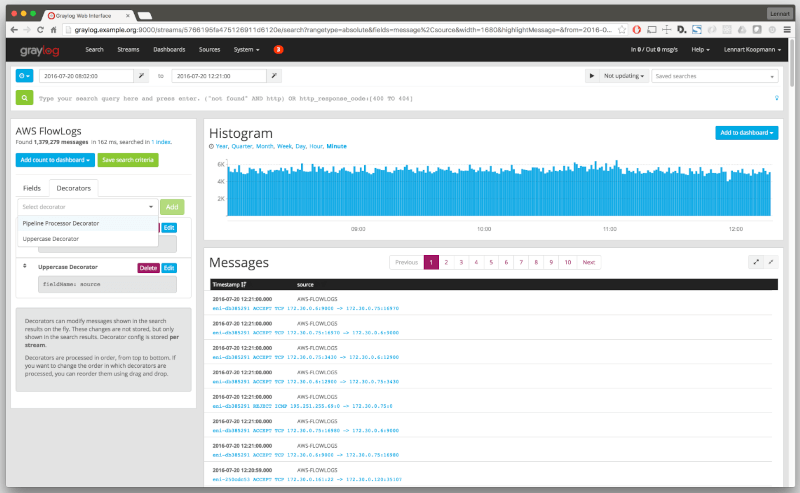
Graylog
With the integration of the Elasticsearch analytics engine and MongoDB, Graylog can be used to help users quickly collect data from multiple devices such as routers and wireless access points. The user interface – called WebUI – is user-friendly and offers many different functionalities, such as the ability to alert users when a certain condition is met, or an issue has occurred.
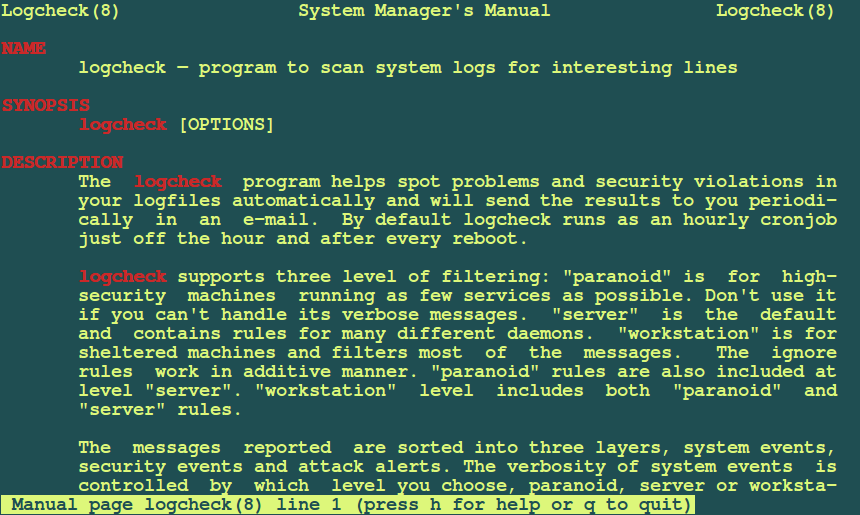
Logcheck
Another open-source log management tool is Logcheck. Able to search through large amounts of log files, Logcheck can detect triggered violations or system events. It can then send a detailed summary of the alerts to a configured email address. This is important for operations teams as the summary can alert them to an issue such as system faults or unauthorized breaches. Logcheck is also capable of sorting messages to be reported into three possible layers, which include security events, system events, and system attack alerts.
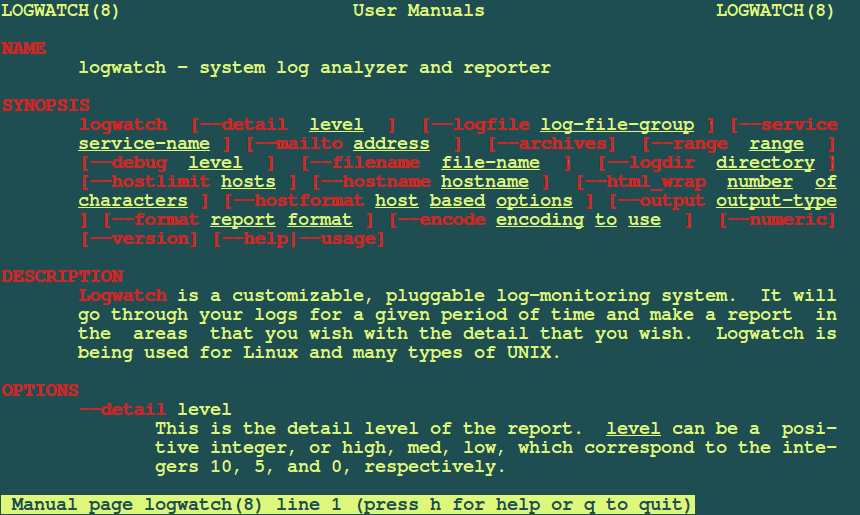
Logwatch
An open-source and highly customizable log collection and analysis application, Logwatch can parse system and application logs and generate reports on how applications run. Users unable to work alongside a proprietary log management tool can rest assured that Logwatch will have all events logged and notifications delivered in the case of any errors or other discrepancies.
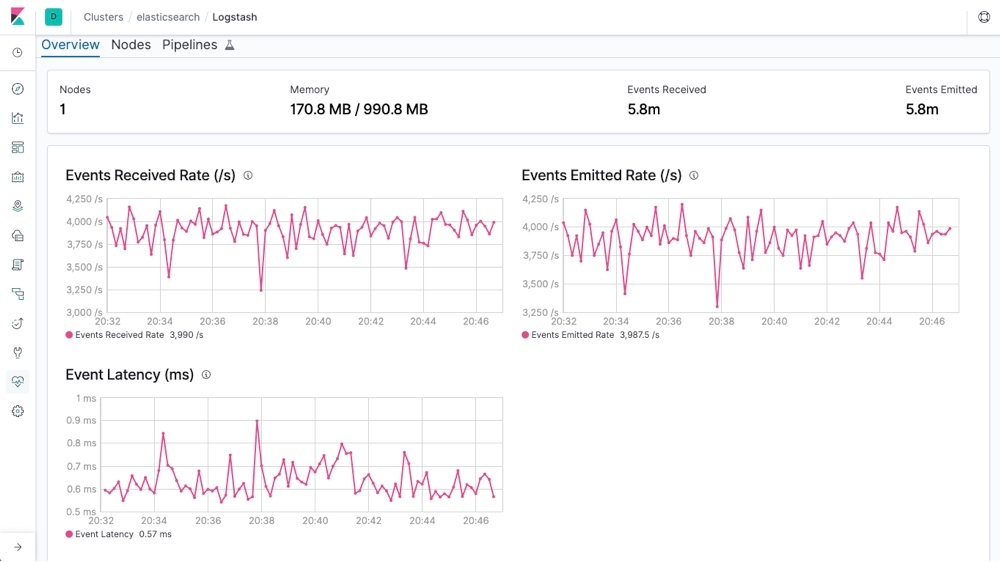
Logstash
An open-source server-side data processing pipeline, Logstash accepts data from many different sources, including local files or distributed systems such as S3. Logstash then processes the logs and funnels them to search and analytics engines such as Elasticsearch, where they are analyzed and archived. A powerful tool, it can ingest large amounts of logs from multiple applications and output them into different databases or engines simultaneously. In addition, Logstash has an extensive list of data sources that can be piped, including SNMP, heartbeats, syslog, Kafka, etc. For use cases where DevOps professionals are concerned about the observability of their cloud server operations, Logstash is available to provide them a platform to gain that observability.
Transitioning to Linux SIEM Platforms
As your infrastructure grows, you may need more than just a basic log analyzer linux tool. Moving toward a Linux SIEM or a dedicated SIEM platform allows you to correlate data across your entire network. These SIEM tools offer advanced features like behavioral analysis and automated threat hunting that go beyond standard log viewing.
Closing Thoughts
Understanding how log files work is an essential first step for any user. Learning more about linux log analysis and linux log management will expand your knowledge for technology roles in administration, development, and cybersecurity. Practical log analysis ensures that malicious activity and system bugs never go unnoticed.


Powered By

Linux Security - Your source for Top Linux News, Advisories, HOWTOs and Feature Releases
QUICK LINKS
subscribe to newsletters!
Like staying secure? So do we.
Sign up for updates, tips, and alerts!