Explore top 10 tips to secure your open-source projects now. Read More
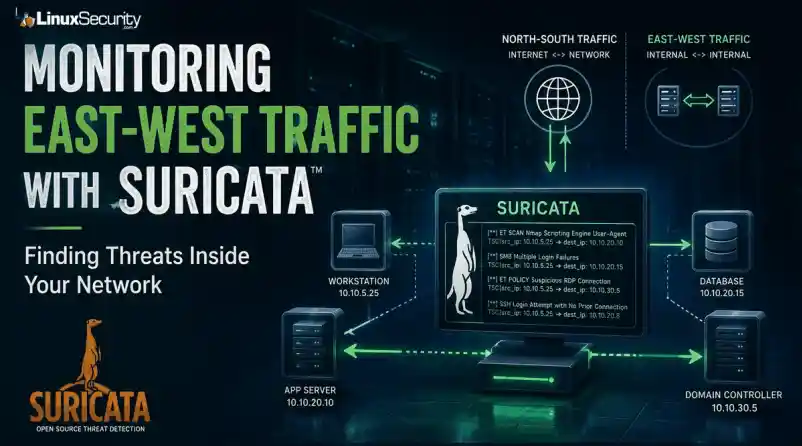
×Monitoring East-West Traffic with Suricata: Finding Threats Inside Your Network
4 - 7 min read
Most security teams are locked into a perimeter-first mindset. They obsess over north-south traffic—the data hitting the edge—while ignoring the reality of the modern data center. Once an attacker gets a foothold, they don't stay at the edge. They pivot. They move laterally. That's the east-west traffic problem: the internal chatter between servers, microservices, and databases that we treat as "trusted" simply because it’s inside the fence.
Using Suricata for east-west monitoring isn't about deploying another sensor. It’s about building a detection strategy that turns that internal silence into data.
Note on Infrastructure: This guide assumes the use of a Linux-based sensor. Suricata’s ability to achieve high-throughput, real-time packet inspection relies on Linux-native kernel interfaces like AF_PACKET and eBPF. The tools used for analysis—jq, tcpdump, and ethtool—are standard utilities in the Linux ecosystem, making it the industry-standard OS for high-performance security monitoring.
What Is East-West Traffic?
In network security, we distinguish between two primary traffic flows:
- North-South: Traffic entering or leaving the network (ingress/egress).
- East-West: Traffic moving laterally between systems inside the environment.
|
North-South Traffic |
East-West Traffic |
|
User browsing a website |
Web server communicating with a database |
|
Customer accessing an application |
Application server talking to another application |
|
Email arriving from the internet |
Domain Controller authenticating users |
|
Data leaving for a cloud service |
Administrator connecting to a server via |
Most organizations already monitor north-south traffic extensively because it crosses the network perimeter. East-west traffic is different. Because it stays inside the wire, it is often blindly trusted. In reality, internal communications frequently contain the earliest indicators of a compromise.
Why Attackers Care About Internal Traffic
When an employee clicks a phishing link and installs malware, the attacker isn't finished—they are just getting started. Their objective is movement. They spend hours, or even days, identifying systems, discovering drives, enumerating user accounts, and testing remote access.
This is lateral movement. Rather than attacking directly from the internet, the adversary pivots through your environment to reach a high-value target. This activity creates network noise: workstations scanning subnets, accounts accessing administrative shares, and unexpected SSH or RDP connections. If you aren't monitoring this, you are letting the attacker move freely through your "safe" zone.
What Is Suricata?
Suricata is an open-source engine designed to inspect network traffic in real time. It is far more than a basic packet capture tool; it acts as an IDS, an IPS, or a powerful NSM platform.
Suricata understands application-layer protocols—like HTTP, TLS, DNS, SMB, and SSH. This allows you to identify suspicious behavior based on protocol patterns rather than relying on brittle IP and port matching. For internal monitoring, this application-layer visibility is your most powerful weapon.
Why Use Suricata for East-West Monitoring?
Internal networks are rarely as clean as we hope. They are full of accumulated complexity: legacy apps with undocumented connections, misconfigured services, and administrative tools that reach across segments.
When you start inspecting this traffic with Suricata, you will discover behavior you didn't know existed. While not all of it is malicious, seeing it is the only way to establish a baseline. You need to know exactly which services are talking, the protocols they are using, and the patterns that define your stack.
A Simple Real-World Example
Consider a three-tier application:
- Web Server: Receives user requests.
- Application Server: Processes business logic.
- Database Server: Stores application data.
Under normal conditions, these paths are predictable. But if Suricata suddenly flags an employee workstation establishing SMB sessions directly to your database, you have an immediate red flag. It may be legitimate, or it may be an indicator of stolen credentials or unauthorized discovery. Without east-west visibility, that connection is invisible.
Where Should You Deploy Suricata Sensors?
You can’t mirror every port in the rack—that’s a recipe for packet loss and a mountain of useless logs. Strategic placement is the only way to scale.
- Protect the Crown Jewels: Focus sensors on segments housing Domain Controllers, sensitive databases, and management VLANs. Lateral movement dies when it hits a monitored high-value segment.
- Monitor Trust Boundaries: Place sensors at the chokepoints between internal segments. If your web tier is separate from your app tier, that is your first deployment point.
- Passive Over Inline: Start in Passive Mode using a TAP or a SPAN port. Don't go inline until you know what your "normal" looks like. Putting a blocking IDS in front of an internal application without a baseline is how you create your own outage.
Build a Baseline Before Writing Rules
A tool is only as good as the logic you feed it. Don't write rules until you see the data. Use jq on your Linux command line to parse your eve.json logs and identify the most frequent talkers.
Find the most frequent internal talkers:
Bash
grep '"event_type":"flow"' eve.json | \
jq -s 'group_by(.src_ip, .dest_ip) | map({src: .[0].src_ip, dest: .[0].dest_ip, count: length}) | sort_by(.count) | reverse' | head -n 10
What Should You Detect?
Focus your rule set on behavior, not signatures:
-
Internal Recon: Alert on internal port scanning. An app server shouldn't be running an
nmapscan against its neighbor. -
Credential Abuse: Look for
SMBadmin share access or unusualRPCcalls. -
Protocol Abuse: Flag unauthorized
SSH,RDP, orWinRMtraffic between hosts that have no operational business communicating.
Context is Everything
If Suricata fires an alert, a log processor needs to tag it with asset criticality. An alert on a dev server is background noise; the same alert on a Domain Controller is an immediate incident.
Workflow: From Detection to Investigation
Suricata creates high-fidelity logs, but logs aren't answers. You need a workflow:
-
Pipeline: Feed
eve.jsoninto a centralized logging stack. -
Noise Reduction: If your configuration management tool (e.g.,
Ansible) hits every server on port22every 30 minutes, suppress those alerts early. -
Correlation: When an alert fires, pivot to your endpoint logs. Did that internal alert on Server A happen at the exact same time as a suspicious
PowerShellexecution? That's your correlation.
Monitoring Encrypted Internal Traffic
East-west traffic is increasingly encrypted. You don't need to decrypt every packet to gain visibility.
-
Log TLS Metadata: Use Suricata to log the
SNI(Server Name Indication) to see which domains are being requested. - Fingerprinting: Use JA3/JA3S fingerprints to identify clients. A standard browser looks different than a custom Python lateral movement script.
- Identify Protocol Mismatches: Catch services running on the wrong ports:
Bash
grep '"proto":"SSH"' eve.json | grep -v '"dest_port":22'## Performance Considerations
Monitoring east-west traffic often means dealing with significantly higher volumes than the perimeter. Because Suricata is running on Linux, you have granular control to optimize performance:
* **CPU Affinity:** Pin processing threads to specific physical CPU cores in suricata.yaml to prevent context switching from killing your throughput.
* **Disable NIC Offloading:** Always disable LRO/GRO to ensure Suricata sees the full packets:
```bash
sudo ethtool -K eth0 gro off lro offNUMA Locality: Ensure your NIC and the CPU cores running Suricata are on the same NUMA node to avoid memory access latency.
Verify What the Sensor Sees
Never assume the sensor is seeing the traffic. Use tcpdump to verify:
Bash
sudo tcpdump -i eth1 -n host 192.168.1.50Final Thoughts
Internal monitoring is a game of diminishing returns if you let the noise level get out of hand. Analysts will ignore your tools if they're constantly crying wolf.
Suricata is a beast of an engine, but it doesn't run itself. By focusing on high-value segments and prioritizing visibility over blocking, you turn your internal network from a "safe zone" into a controlled environment where lateral movement is finally visible.
Powered By

Linux Security - Your source for Top Linux News, Advisories, HOWTOs and Feature Releases
QUICK LINKS
subscribe to newsletters!
Like staying secure? So do we.
Sign up for updates, tips, and alerts!