Explore top 10 tips to secure your open-source projects now. Read More
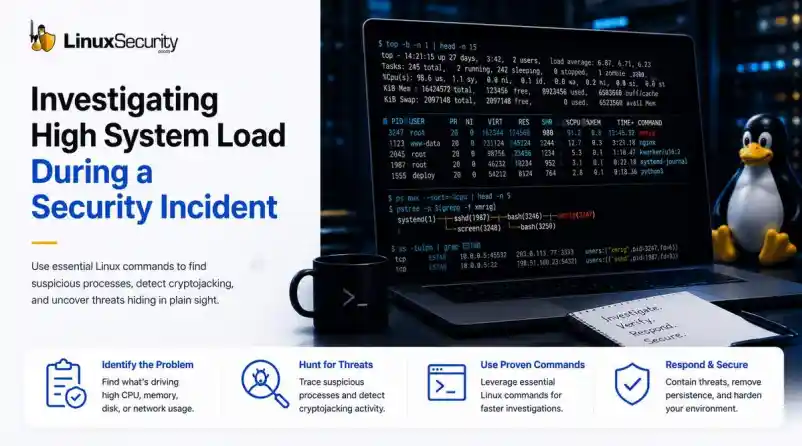
×How to Investigate High System Load During a Security Incident
4 - 7 min read
When a production server spikes at 99% CPU or the disk starts grinding, the knee-jerk reaction is usually to blame a bad code push or a runaway backup job. But if you’ve spent enough time in security incident response, you know that "performance issues" are often the first sign that you’re dealing with Linux malware.
If you don't have a systematic way to look past the performance graphs, you’re just guessing. Here is how you use Linux commands to peel back the layers when a system starts acting erratically.
Understanding What "Normal" Load Means
Before you touch a command, figure out what changed. A lot of ugly-looking spikes in Linux CPU usage end up being backups, software updates, or some forgotten batch job that nobody documented. Sometimes it's worse. The point is that you don't know yet.
Build a timeline before you start chasing theories. When did the load increase? Did it happen after a deployment? Is it one server or twenty? The answers usually tell you where to look next.
Once you've got that, start identifying what's actually consuming the resources.
Step 1: Identify the Resource Under Stress
Stop looking at the load average and start looking at the character of the load. Use standard Linux commands to isolate the bottleneck:
- CPU: Use the Linux
topcommand orhtopto identify the most active tasks. - Memory: Run
free -hto see if your Linux memory usage is being cannibalized by unauthorized processes. - Disk: Run
iostat -xz 5to see if the disk I/O is saturated. - Network: Use
iftopto see if there is unexpected data movement.
Step 2: Find the Process Responsible
At some point, every load investigation comes down to a process.
Maybe the server is pinned at 100% CPU. Maybe memory usage is climbing until the system starts swapping. Whatever the symptom, the next question is always the same: what's actually consuming the resources?
Start by looking at the busiest processes on the system:
ps aux --sort=-%cpu | headIf memory pressure is the problem, switch your focus:
ps aux --sort=-%mem | headFinding the process is only the beginning. The more useful question is how it got there. A process name by itself rarely tells the whole story, which is why I usually follow the process tree next:
pstree -pAttackers don't need creative names. A malicious process can blend in perfectly if it's launched from something that looks legitimate. The parent-child relationship often reveals far more than the process name ever will. A service spawning an unexpected shell, a web server launching a binary, or a user process creating background workers are all worth a closer look.
Step 3: Investigate the Process Context
If a process looks suspicious, don't kill it yet. If it’s a Linux security incident, you might be helping the attacker clear their tracks.
- Verify location: Use
whichorls -lah /proc/. If the binary is running out of/exe /tmpor/dev/shm, treat it as suspicious until proven otherwise. - Check User Context: Run
ps -o user,pid,cmd -p. A process running as root that originates from a temporary directory is a massive red flag.
Step 4: Detecting Cryptojacking
Cryptojacking has become the go-to for attackers because it’s easy money. It doesn't look like an intrusion; it just looks like a hungry application. But miners have a tell: they have to talk to a mining pool.
Use the Linux ss command (ss -tulpn) or netstat -plant to view your connections. If you see persistent, long-lived connections to foreign IPs on unknown ports, that is your indicator. If a process is consuming 80% CPU and talking to an external host, you have found the source of your Linux malware.
Step 5: Check for Persistence
Attackers aren't stupid. They know you’ll restart the machine or kill the process, so they need a way to make sure their code comes back.
I start with the basics. Run crontab -l for the current user, but don't stop there. Attackers love hiding in the system-wide crons. Go dig through the files in /etc/cron.*—I’ve personally caught more than one backdoored script tucked into cron.daily or cron.weekly because the attacker knew a once-a-week execution would keep their resource footprint low enough to dodge most basic alerts.
Then, hit the services. Run systemctl list-units --type=service. If you see a service name that looks like a garbled string or just doesn't belong, that’s your lead. Pull the unit file and see what it’s actually executing. It’s almost never a legitimate service; it’s usually just a lazy wrapper script that points to a hidden binary somewhere else on the disk.
Step 6: Review Logs for Supporting Evidence
When you’re in the middle of a security incident response event, looking at logs feels like a chore, but it’s where the story is actually written.
Stop scrolling blindly. Use journalctl -xe to see what the kernel and system have been complaining about. If I suspect a remote breach, my first stop is journalctl -u ssh. I'm looking for the obvious stuff—failed logins that look like brute-force attempts—but keep an eye out for the successful logins from IPs that make no sense. If you see a user you don't recognize, or a sudden sudo elevation right before the resource spike started, you’ve found your entry point. Attackers aren't usually quiet about service installations, either; look for entries that show new binaries being dropped or permissions being changed. It’s the digital equivalent of seeing someone leave muddy footprints all over your clean floor.
When to Remediate
When you are sure it’s malicious, you may need to kill a Linux process—but don't destroy your evidence first. Before you execute the command to kill a process in Linux (kill -9 ), make sure you have:
- Captured the process arguments and environment variables:
ps eww -pandcat /proc/./cmdline - Documented active network connections.
- Preserved logs and taken screenshots or exports from your EDR.
- Collected hashes of the suspicious binary:
sha256sum /path/to/binary.
After the adrenaline fades, align your internal procedures with CISA Incident Response & Recovery guidance. If you find a compromised process, cross-reference the behavior with the MITRE ATT&CK Resource Hijacking technique.
Final Thoughts on Linux Security
High load is a symptom. Whether it’s just a bad database index or a serious breach, the methodology remains the same: keep your head, trace the process, verify the context, and don't take anything at face value. Tools like Red Hat's performance monitoring documentation are there for a reason—master them, and you’ll spend a lot less time guessing.
Want more Linux security news, vulnerability analysis, and software supply chain updates? Subscribe to the LinuxSecurity Newsletter and get the latest threats, advisories, and expert insights delivered directly to your inbox.
Related Reading


Powered By

Linux Security - Your source for Top Linux News, Advisories, HOWTOs and Feature Releases
QUICK LINKS
subscribe to newsletters!
Like staying secure? So do we.
Sign up for updates, tips, and alerts!