Explore top 10 tips to secure your open-source projects now. Read More
×


Stay Ahead With Linux Security HOWTOs
How to Learn Tips and Tricks threat detection system monitoring
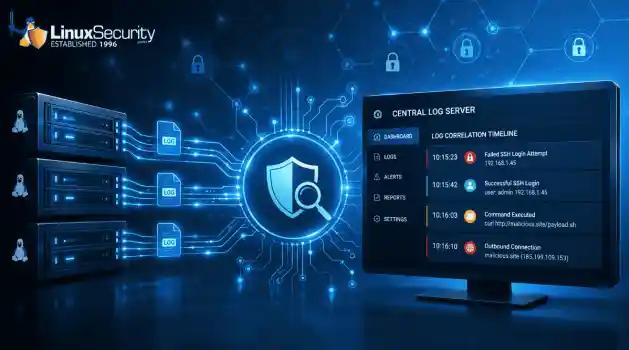
threat detection system monitoring For small security and IT teams, the "enterprise" dream of a fully automated SIEM often feels like a distant luxury. It’s a vision built on massive budgets and dedicated engineering teams—things that, frankly, most of us don't have. But here is the reality: you don’t need a six-figure platform to maintain a secure environment. . Linux systems are, by design, incredibly verbose. Every time a user authenticates, a process executes, or a configuration file changes, your system creates a record of...
 Jul 17, 2026
How to Learn Tips and Tricksnetwork security centralized logging
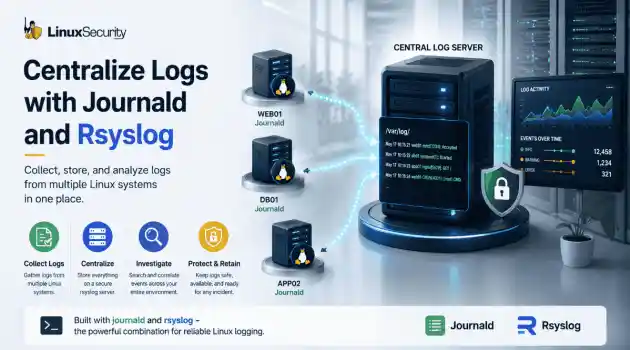
network security centralized logging Linux systems generate a steady stream of authentication, service, kernel, and application logs. On most systems, those logs never leave the machine that created them. If you're responsible for ten or twenty servers, that means checking each one separately. If one disappears before you can investigate it, its logs may disappear with it. Centralized logging solves that by sending log messages to another server as they're created. Instead of searching every machine, you have one place to review...
Jul 15, 2026
How to Secure My Networksecurity advisory audit
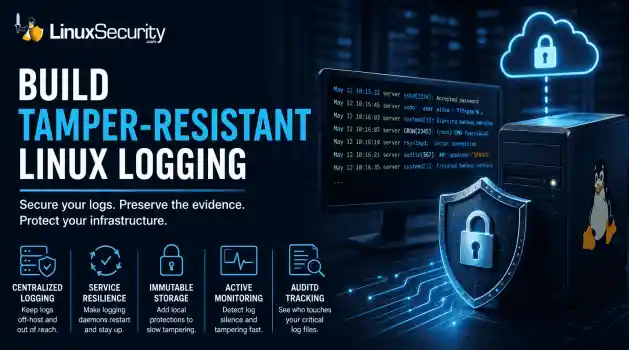
security advisory audit When you’re digging through an incident, your logs are the only thing you can actually trust. The problem is, attackers know that too. If someone gets root on your server, their first move is almost always to delete the evidence and cover their tracks. . If you aren't actively protecting your logs, you're basically flying blind the second a breach happens. It’s a miserable feeling to realize you have no idea what an attacker did because they wiped the logs before you even got there. In this...
Jul 11, 2026
How to Harden My Filesystemlog analysis security incident
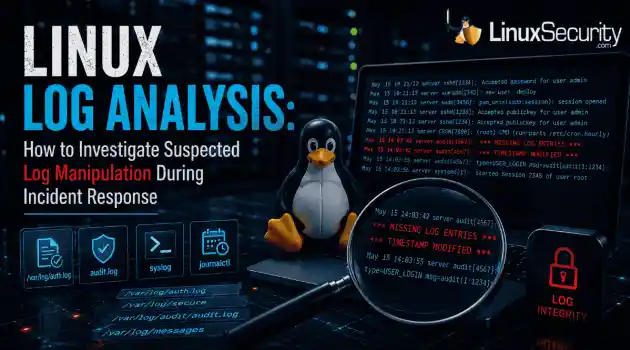
log analysis security incident When an attacker breaks into a Linux system, their work is rarely done. Usually, the real work starts after the initial exploit: hiding their tracks. If you’re a Linux admin or security analyst, there is nothing worse than logging in, running a few commands, and realizing the logs aren't telling the whole story. When logs are missing or look "off," your primary source of truth is compromised. This guide covers how to handle that situation. We’ll walk through the workflow you need to determine...
Jul 10, 2026
How to Learn Tips and Trickssecurity practices linux
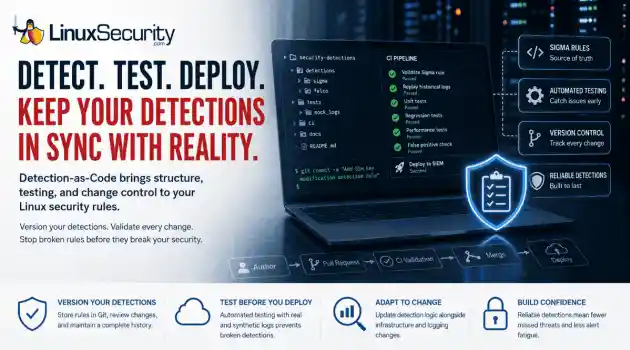
security practices linux One of the easiest mistakes to make in detection engineering is assuming a rule keeps working simply because nobody has touched it. Most of the time, nobody removes the rule. Nobody disables it. It just gets forgotten. . A few months later, someone upgrades a distribution, changes how SSH keys are managed, replaces a logging agent, or migrates an application to containers. The detection is still enabled, but it's watching an environment that no longer exists. The alert everyone expected never...
Jul 07, 2026
 Refine HOWTOs
X Clear Filters
Get the latest News and Insights
Get the latest Linux and open source security news straight to your inbox.
Community Poll
Is continuous patching actually viable?
Loading...
Explore Latest Linux Security HOWTOs
We found 332 articles for you...
166
 threat detectionsystem monitoringremote logging
How to Correlate Linux Logs for Faster Threat Detection
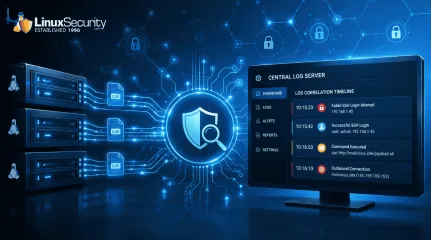
For small security and IT teams, the "enterprise" dream of a fully automated SIEM often feels like a distant luxury. It’s a vision built on massive budgets and dedicated engineering teams—things that, frankly, most of us don't have. But here is the reality: you don’t need a six-figure platform to maintain a secure environment. . Linux systems are, by design, incredibly verbose. Every time a user authenticates, a process executes, or a configuration file changes, your system creates a record of that activity. The problem isn’t that we lack data; it’s that we often lack the time to sift through it. By mastering manual log correlation, you stop being a passive recipient of alerts and start becoming a proactive hunter. You don’t need an expensive tool to gain high-level visibility—you just need a disciplined, repeatable workflow. Getting Your Environment Ready Before you start hunting, you need to make sure your data is actually reliable. A security guide is only as good as the logs you're pulling from. Check your permissions: You’ll need root or sudo to read logs. Just run sudo whoami ; if it doesn't spit back root , you won’t get far. Time matters: If your server clocks aren't synced, your logs are essentially useless for building a timeline. Run timedatectl . If the system doesn't say the clock is synchronized, stop and fix it first. Auditd is your best friend : If you aren’t running auditd , you’re flying blind. Run systemctl status auditd . If it isn't active, enable it with sudo systemctl enable --now auditd . If your time is drifting, just spin up systemd-timesyncd and save yourself the headache later. A Quick Word on Logs Different Linux flavors have different habits. Old-school setups love dumping everything into flat text files, while modern systems use the systemd journal . If you go looking for /var/log/auth.log or /var/log/secure and they aren't there, don't panic—you’re likely on a newer system. Just reach for journalctl instead. A Simple Three-Step Investigative Routine Don’t dive into logs blindly. It’s a great way to get overwhelmed. Instead, use this three-step cycle to keep your sanity: 1. Isolate the user Start with the "who." If a username looks sketchy, filter the logs so you aren't fighting through pages of noise. Bash grep "username" /var/log/auth.log Look for anything that breaks their usual routine. If you see them logging in from three different countries in ten minutes, you know exactly what you’re dealing with. 2. See what happened around the event Logs are just a scattered pile of breadcrumbs until you put them in order. If you find something weird at 2:00 PM, check the minutes right before and after it. Bash grep -C 20 "14:00:00" /var/log/syslog That -C 20 flag shows you 20 lines of context. That window is almost always where the "trigger" event is hiding—the service crash or the config change that opened the door. 3. Verify via Auditd auditd acts as your flight recorder. Even if an intruder deletes their shell history, the kernel record persists. Bash ausearch -ua [UID] -m EXECVE This extracts every binary execution associated with a user ID. If the command returns a list of strange binaries, you have undeniable evidence of unauthorized activity. Scenario: From Alert to Investigation Imagine a web server reports a flood of failed SSH attempts. This is common, but what if one finally succeeds? By correlating auth.log (who entered), auditd (what they executed), and system logs (what happened next), you might discover that the attacker logged in, ran curl to pull a script, and opened an outbound connection. Because you utilized the Entity → Timeline → Audit workflow, you identified a compromise in minutes. This turns a high-stress incident into a controlled, manageable response. Essential Hunting Commands Focus Area Command Why it works Brute Force Detection grep "Failed password" /var/log/auth.log | awk '{print $11}' | sort | uniq -c | sort -nr Isolates the most frequent IP attackers instantly. Sudo Abuse grep "sudo:.*COMMAND=" /var/log/auth.log Reveals which commands are being run with elevated power. Focused Service Monitoring journalctl -u ssh --since "1 hour ago" Filters out the noise, showing only SSH-related events. Getting Logs Off-Box (The "Poor Man's SIEM") If you’re managing more than two servers, logging into each one individually is a waste of time and a security risk. You need to ship those logs to a central server. It’s not just about convenience; if someone manages to compromise a server, their first move is usually to delete the local logs. If your logs are already sitting safely on another box, they can’t hide their tracks. On your clients: Edit /etc/rsyslog.conf and point them to your server: *.* @@your-log-server-ip:514 . Using @@ forces TCP, which is what you want—it’s more reliable than UDP. On the central server: Make sure the imtcp module is enabled so it's actually listening for those connections. Verification: Run logger "Central logging test" on a client. If you see that line show up on your central log server, you’re good to go. Wrapping Up Manual log correlation isn't just about ticking boxes; it's about learning the "rhythm" of your servers. Eventually, you’ll spend enough time in the files that you’ll be able to spot an anomaly just by glancing at the terminal—it just won't "feel" right. When you eventually graduate to a full-blown SIEM like Wazuh or Graylog , you’ll be ahead of the curve. You won’t be drowning in alerts because you’ll already understand the relationship between the events you're seeing. Your Next Steps: Keep a cheat sheet: Keep the three steps above on a post-it note. Seriously, it helps. Just get started: Don't waitfor a crisis. Spend 15 minutes this week " grepping " through the logs on one of your machines. Stay sharp: Sign up for the LinuxSecurity newsletter to keep an eye on new threats. Are you currently collecting your logs in one place, or is your team still hopping between servers to figure out what's going on? . Learn efficient techniques for faster threat detection through manual correlation of Linux logs without relying on costly tools.. Linux logs, threat detection, manual correlation, auditd, system logging. . MaK Ulac
 Jul 17, 2026
•
Jul 17, 2026
• How to Learn Tips and Tricks
166
 network securitycentralized logginglog management
How to Configure Centralized Logging with Journald and Rsyslog
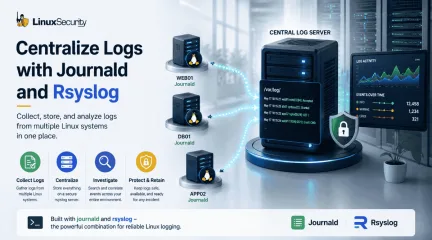
Linux systems generate a steady stream of authentication, service, kernel, and application logs. On most systems, those logs never leave the machine that created them. If you're responsible for ten or twenty servers, that means checking each one separately. If one disappears before you can investigate it, its logs may disappear with it. Centralized logging solves that by sending log messages to another server as they're created. Instead of searching every machine, you have one place to review activity across your environment. This tutorial uses journald and rsyslog to build that setup. . Before You Begin To follow this tutorial, you need: One Linux system to act as the central rsyslog server At least one Linux client that will forward logs Root or sudo access on each system rsyslog installed on the server and clients Network connectivity between the systems TCP port 514 allowed through the server firewall The commands in this guide use TCP because it provides more reliable delivery than UDP. File locations and firewall commands may vary between Linux distributions. What Is Centralized Log Management in Linux? Centralized log management collects logs from multiple Linux systems and stores them on a central server instead of leaving them scattered across individual machines. If all you have is one server, local logs usually aren't a problem. Open journalctl or check the files under /var/log , and you're looking at everything that machine recorded. The workflow changes once more systems are involved. An application error on one server often shows up on another. A failed authentication attempt might appear on several systems within a few seconds. Looking for those events means repeating the same searches until you've checked every machine. Forwarding logs removes most of that work. Each server keeps writing logs locally, but it also sends another copy to a central rsyslog server. When you start investigating, that's normally the first systemyou open. You'll use two services to make that happen. journald records the log messages. rsyslog forwards them using your Linux syslog configuration. The logs stay on the local machine, but another copy is already waiting on the central server. How Journald and Rsyslog Work Together journald records the logs on each Linux system. rsyslog moves those logs to the central server, while journalctl lets you check the local copy. Component Role in centralized logging journald Records log messages on the local Linux system. journalctl Reads and searches the logs stored by journald . rsyslog Forwards local log messages to the central rsyslog server. Central rsyslog server Receives logs from multiple Linux systems and stores them in one place. Why Centralized Logging Matters Centralized logging keeps another copy of your logs on a separate system, so they remain available even when the original server isn't. Local logs work well until the server becomes part of the problem. A failed disk, an accidental deletion, or a compromised system can remove the records you were planning to review. A central logging server changes that. Every Linux system still keeps its own logs, but it also forwards another copy across the network. If one machine becomes unavailable, the forwarded logs are still there. The difference becomes obvious during an investigation. The same application error, failed login, or service failure can appear on several systems within a few minutes. Searching one central rsyslog server is usually faster than repeating the same search on every machine. Long-term storage gets easier too. Production servers no longer have to keep months of historical logs because the central server is already collecting them. That's one reason centralized log management is commonly used for troubleshooting, compliance, and incident response. Step 1: Verify Journald and Rsyslog Are Installed journald and rsyslog both need to be running before logs can be forwarded to another system. Start with journald . systemctl status systemd-journald The service should report: Active: active (running) That tells you the local journal is running. rsyslog is next. systemctl status rsyslog You're looking for the same status. Active: active (running) An inactive service isn't running. A failed service tried to start but stopped because of an error. Both need to be fixed before log forwarding will work. Step 2: Configure Persistent Journald Storage Persistent journal storage keeps log messages after a system reboot. A reboot can interrupt an investigation just as quickly as a deleted log file. If the journal only exists in memory, everything recorded before the restart disappears with it. Creating /var/log/journal changes that. sudo mkdir -p /var/log/journal Restart journald after creating the directory. sudo systemctl restart systemd-journald From that point on, new journal entries are written to disk instead of temporary storage. journalctl can confirm the change. journalctl --disk-usage You'll see how much space the journal is using. If the output reports disk usage, journald is writing persistent logs. Step 3: Configure Journal Retention Journal retention controls how long journald keeps logs and how much disk space they can use. Persistent storage keeps logs after a reboot. Retention decides how much of that history stays available. Without limits, the journal keeps growing until it reaches the storage limits of the system. The retention settings live in the journald configuration file. sudo nano /etc/systemd/journald.conf You'll find several options that control how the journal stores and removes log data. Setting What it changes Storage= Chooses whether the journal is stored inmemory, on disk, or both. Compress= Compresses older journal files to reduce disk usage. Seal= Adds integrity protection so changes to journal files can be detected. SystemMaxUse= Limits how much disk space persistent journals can use. RuntimeMaxUse= Limits how much memory runtime journals can use. MaxRetentionSec= Removes journal files after they've reached the configured age. A small server and a production server rarely need the same retention policy. A development system might only keep a few days of logs. A production server often keeps weeks or months, depending on available storage and internal requirements. One example looks like this. [Journal] Storage=persistent Compress=yes Seal=yes SystemMaxUse=2G RuntimeMaxUse=200M MaxRetentionSec=30day Each setting changes a different part of how the journal grows over time. SystemMaxUse keeps the journal from filling the disk. MaxRetentionSec removes older logs after they reach the configured age. Compress reduces the space used by older journal files, while Seal helps detect whether those files have been modified. Together, these settings keep the journal large enough for troubleshooting without allowing it to consume all available storage. Step 4: Configure Rsyslog to Receive Journald Messages journald already has the logs. The next step is getting those logs to rsyslog . Nothing leaves the server yet. Every log message is still local, even though persistent storage is enabled. Forwarding starts once journald begins passing its messages to rsyslog . Open the journald configuration file. sudo nano /etc/systemd/journald.conf Find this setting. ForwardToSyslog=yes On many Linux distributions, rsyslog already receives messages from journald through its default configuration. If ForwardToSyslog is disabled and rsyslog isn't receiving journalentries, enable it by removing the leading # or adding the setting if it doesn't exist. Note If your distribution already forwards journal messages through another input module, enabling ForwardToSyslog=yes may create duplicate log entries. Restart both services after saving the file. sudo systemctl restart systemd-journald sudo systemctl restart rsyslog From this point on, new journal entries are handed to rsyslog as they're created. The logs still exist on the local server, but rsyslog can now process and forward them to another system. One quick check is enough before moving on. systemctl status rsyslog rsyslog should report active (running) . The next step is giving it a server to forward those logs to. Step 5: Configure a Central Rsyslog Server A central rsyslog server receives log messages from every Linux system that forwards logs to it. Open the main rsyslog configuration file: sudo nano /etc/rsyslog.conf Add the following lines to enable a TCP listener on port 514 : module(load="imtcp") input(type="imtcp" port="514") Before restarting rsyslog , check the configuration for syntax errors: sudo rsyslogd -N1 A successful check should end with a message indicating that the configuration validation completed without errors. Next, allow TCP port 514 through the firewall. On Ubuntu or Debian systems using UFW : sudo ufw allow 514/tcp On RHEL-family systems using firewalld : sudo firewall-cmd --permanent --add-port=514/tcp sudo firewall-cmd --reload Restart rsyslog : sudo systemctl restart rsyslog Confirm that the service is running: sudo systemctl status rsyslog Then verify that rsyslog is listening on TCP port 514 : sudo ss -lntp | grep ':514' The output should show a listening socket on port 514 . Important Do not expose an unencrypted rsyslog listener directly to the public Internet. Use a private network, firewall restrictions, or TLS-securedforwarding. By default, some Linux distributions write incoming remote messages to the same system log used for local events, while others use different destinations depending on the rsyslog configuration. For larger environments, many administrators create a dedicated directory such as /var/log/remote/ and store logs in separate folders for each hostname to simplify troubleshooting and log retention. Step 6: Configure Linux Clients to Forward Logs Every Linux client needs a forwarding rule before log messages can reach the central rsyslog server. This rule tells rsyslog where to send copies of locally generated log messages. The server is ready to receive logs. The clients still need to know where those logs should go. That's done with a forwarding rule in the rsyslog configuration. A basic forwarding rule looks like this. *.* @@192.168.1.100:514 Replace 192.168.1.100 with the address of your rsyslog server. The *.* selector forwards every facility and every priority. The double @@ sends log messages over TCP. A single @ sends them over UDP. TCP is the better choice for most centralized logging deployments. It confirms messages are delivered before sending the next one. UDP sends messages without waiting for a response. It's faster, but dropped packets stay dropped. Many production environments also encrypt remote logging with TLS. The forwarding rule stays the same. The rest of the Linux syslog configuration adds the certificates needed to secure the connection. Restart rsyslog after saving the configuration. sudo systemctl restart rsyslog New log messages now have somewhere to go. Tip Use @@ to forward logs over TCP. TCP is generally the better choice because it provides connection-based delivery and can detect transmission failures. A single @ uses UDP, which has less overhead but may lose messages without notifying the sender. Step 7: Verify Logs Reach the Central Server A test message confirms the entirecentralized logging pipeline is working. There's no reason to wait for a real event. Generate one instead. logger "LinuxSecurity centralized logging test" The message should appear in the local journal. journalctl -n 10 Search for the test message if it's easier to spot. journalctl | grep "LinuxSecurity centralized logging test" The same message should also appear on the central rsyslog server. On Debian and Ubuntu systems, check: grep "LinuxSecurity centralized logging test" /var/log/syslog On RHEL-family systems, check: grep "LinuxSecurity centralized logging test" /var/log/messages You can also search both common locations: sudo grep -R "LinuxSecurity centralized logging test" \ /var/log/syslog /var/log/messages 2> /dev/null Log file locations vary by distribution and rsyslog configuration. If you configure a custom template for remote logs, search that directory instead. Step 8: Secure Your Logging Infrastructure A centralized logging server holds data from every system that forwards logs to it, so it needs the same level of protection as the systems it monitors. Log forwarding moves copies of your logs across the network. Encrypting that traffic with TLS keeps log messages from being read or modified while they're in transit. That's especially important when remote logging crosses untrusted networks. The logs themselves need protection too. Limit access to the rsyslog server, use restrictive file permissions, and avoid giving unnecessary users access to log data. The fewer people who can modify log files, the easier they are to trust during an investigation. Some environments take another step and use immutable storage. Once the logs are written, they can't be changed without leaving evidence behind. That's useful when logs need to support compliance requirements or forensic investigations. Many organizations also separate logging traffic from normal application traffic. A dedicated logging network reduces unnecessary exposureand keeps large volumes of log data away from production workloads. The logging server should follow the same maintenance routine as any other Linux system. Rotate log files before they fill the disk, back up important log data, and test those backups regularly. A backup that has never been restored is only a backup on paper. Step 9: Troubleshoot Common Logging Problems Most centralized logging problems come down to a small number of configuration or connectivity issues. A journal that disappears after every reboot usually points to non-persistent storage. Check that /var/log/journal exists and confirm the retention settings in journald.conf . Logs that never reach the rsyslog server often trace back to the forwarding rule. Review the Linux syslog configuration, restart rsyslog , and confirm the service is still running. Firewalls block more logging traffic than most configuration mistakes. If the client can generate logs but the server never receives them, verify the listening port is open on both systems. Missing log entries usually mean looking at both ends of the pipeline. Check the local journal with journalctl first. If the event exists there but not on the central server, the problem happened after journald recorded the message. Incorrect timestamps make investigations much harder. Systems that don't share the same time source rarely produce logs that line up correctly. Keeping every server synchronized with NTP avoids that problem. Duplicate log entries usually mean the same message is being forwarded more than once. Review your rsyslog rules and look for overlapping forwarding configuration. A full disk eventually stops log collection. Check available storage on both the client and the rsyslog server, then review your journal retention and log rotation settings before services start dropping messages. Best Practices A few small configuration choices make centralized logging much easier to manage over time. Keep persistent journald storageenabled. Forward logs from every Linux system instead of only critical servers. Encrypt remote logging with TLS whenever possible. Limit access to the rsyslog server and its log files. Monitor available disk space on both clients and the logging server. Rotate logs before storage becomes a problem. Test log forwarding after configuration changes. Keep every system synchronized with NTP . Review your syslog configuration after major operating system updates. Conclusion You now have a basic centralized logging pipeline: journald records events locally, rsyslog forwards them over TCP, and the central server stores another copy for investigation and retention. Local logs remain useful for troubleshooting individual systems, while the central server gives you one place to compare events across your environment. Test forwarding after every configuration change, monitor available storage, and regularly confirm that incoming logs are being retained as expected. Plain TCP forwarding is a good starting point for a private network. For a production deployment, the next step is to secure the connection with TLS and organize incoming logs by hostname. . Explore how to implement centralized logging using Journald and Rsyslog for improved log management and analysis in Linux.. logging management, centralized logging, Linux log analysis, rsyslog configuration. . Dave Wreski
Jul 15, 2026
•
How to Learn Tips and Tricks

166
 security practiceslinuxmonitoring tools
Detection-as-Code for Linux: Building Security Rules That Last
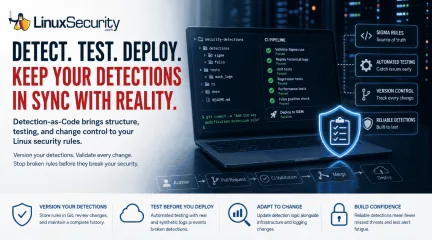
One of the easiest mistakes to make in detection engineering is assuming a rule keeps working simply because nobody has touched it. Most of the time, nobody removes the rule. Nobody disables it. It just gets forgotten. . A few months later, someone upgrades a distribution, changes how SSH keys are managed, replaces a logging agent, or migrates an application to containers. The detection is still enabled, but it's watching an environment that no longer exists. The alert everyone expected never comes because the rule quietly stopped matching reality. I've seen teams spend hours debugging a SIEM only to discover nothing was technically broken. The detection simply hadn't kept up with the Linux systems it was supposed to monitor. Detection-as-Code grew out of that problem. Instead of treating detections as something you configure once inside a security platform, they're managed like any other engineering project. Rules live in Git, changes are reviewed, tests run automatically, and every modification has a history. The technology isn't the interesting part. The discipline is. What Is Detection-as-Code? Detection-as-Code moves the detection out of the SIEM and into a repository. The rule becomes another file that changes alongside the systems it depends on, rather than being edited directly in the platform and forgotten until an alert goes missing. That matters because detection rules depend on assumptions about the environment. A rule looking for changes to ~/.ssh/authorized_keys assumes those file events are being logged exactly the way they were six months ago. If someone replaces auditd with eBPF or moves those workloads into containers, those assumptions break. Keeping your rules in Git doesn't stop those infrastructure changes, but it forces them to be visible. When the logging pipeline changes, you update the detection logic in the same PR as the infrastructure change. You stop fixing "broken" detections reactively and start updating them as part of your standard operationalrhythm. Many teams now use Sigma as their primary language for this. You treat the Sigma rule as your "source of truth." You deploy it, and let your pipeline convert it into the specific dialect your SIEM (Splunk, Elastic, Sentinel) needs. If you ever switch SIEMs, your core logic stays safe in Git. How Does Detection-as-Code Work on Linux? Imagine you notice attackers commonly establish persistence by adding a new SSH key. You don't just hack together a query in your SIEM console. Author: You write a Sigma rule that alerts whenever ~/.ssh/authorized_keys is modified by a process other than your approved configuration management tool. You commit it to your /detections/sigma/ folder. Pull Request (PR): You open a PR. A teammate reviews it, not just for accuracy, but for potential noise. CI Validation: Your pipeline kicks off. It replays historical logs and exercises the detection using an Atomic Red Team test that emulates the targeted persistence behavior, confirming the rule doesn't trigger during normal daily backups. Merge & Deploy: Once the tests pass and a human reviewer signs off, the pipeline automatically pushes the rule to your production SIEM or runtime security tool ( Falco or Tetragon ). How Should You Organize Detection Rules? If you’re going to do this, keep it tidy. A disorganized repository is just as bad as a messy SIEM. I usually set it up like this: /security-detections ├── detections/ │ ├── sigma/ # The core logic │ └── falco/ # Runtime rules ├── tests/ │ └── mock_logs/ # Logs for validation ├── ci/ # Your CI/CD glue ├── docs/ # Explaining the "why" └── README.md Which Linux Data Sources Should You Monitor? You can’t detect what you can’t see. Relying solely on generic logs isn't going to cut it anymore. Auditd: The reliable workhorse for traditional Linux file integrity and system calls. Journald/Systemd: Use this for catching service-level persistence. If a service is created in a weird way, you’ll find it here. Sysmon for Linux : Great if you’re already used to Windows telemetry; it helps bridge the visibility gap between OSes. eBPF (Falco, Tetragon): This is the modern standard for containers and cloud-native workloads. When traditional logs disappear, eBPF sees everything happening at the kernel level. How Do You Test Detection Rules? Testing is the engine of DaC. Without it, you are just automating the deployment of broken rules. The goal is to build a "gatekeeper" in your CI/CD pipeline that validates every detection before it ever reaches production. To move beyond basic syntax checks, your pipeline should implement a multi-layered testing strategy: Replaying historical attack logs: Don't guess if a rule works—prove it. Feed recorded logs from past incidents through your rule to ensure it would have fired correctly. This is the best way to verify your detection logic against real-world adversary behavior. Validating Sigma rules: Use tools like sigma-cli to validate syntax and ensure the rules comply with your schema before they are committed. This catches typos and logic errors before they trigger a CI failure. Unit testing detections: Treat every rule like a piece of application code. Create small, "unit" test files containing only the specific log events required to trigger the rule. If the rule doesn't fire, the test fails. Regression testing: As your library grows, new rules can inadvertently interfere with old ones or create logic overlaps. Run a full suite of regression tests against your entire rule set to ensure that a change to one detection doesn't silence another. Performance testing: Heavy regex or complex sub-queries can grind a SIEM to a halt. Test your rules against a high-volume log stream in a staging environment to ensure they don't introduce unacceptable latency or consume excessive compute resources. False-positive benchmarking: Use a "known-good" set of logs—capturing routine updates, system reboots, and administrative activity—to ensure your rule remains silent on benign noise. If your rule fires during these tests, it’s not ready for production. The automation platform matters less than the workflow. Whether you use GitHub Actions, GitLab CI, Jenkins, or another system, the goal is the same: treat detection testing with the same rigor you apply to your application code. Testing Method Objective Log Replay Does it catch threats from our history? Unit Testing Do specific inputs trigger the expected output? Regression Testing Did I break any of our older rules? Performance Testing Does this query cripple our SIEM? False Positive Analysis Is it going to wake up the team for nothing? Common Detection-as-Code Mistakes to Avoid When starting with DaC, avoid these common traps: Treating Git as a backup: Nope. Git is the only place the rule lives. If it isn't in Git, it shouldn't be in your SIEM. Period. Deploying without automated testing: A rule that hasn't been tested against mock logs is a gamble, not a control. Neglecting tuning: Rules need maintenance. If a rule produces false positives, treat it like a bug and fix it in the repo. Retire obsolete rules: Detection repositories should shrink as often as they grow. If a rule is obsolete, kill it. Removing noise is as important as finding threats. Dependency blindness: Don't write a rule that depends on a log format the infra team is planning to delete next week. When Should You Use Detection-as-Code? Detection-as-Code is not a silver bullet. If you manage five rules in a lab, don't bother. The overhead of setting up a CI/CD pipeline will eat you alive. But if you’re managing hundreds of nodes, have multiple analyststouching the rules, and you're tired of alerts breaking every time someone runs an update—it’s time. The complexity is only justified as you scale. Conclusion Linux infrastructure never stays the same. Containers are rebuilt, kernels are patched, and attackers are always changing their playbook. Detection-as-Code doesn't make your rules "smarter." It makes them maintainable. And in a mature Linux environment, maintainability is the difference between a security program that actually works and a forgotten rule that stopped catching attackers six months ago. . Explore the importance of Detection-as-Code for maintaining effective security rules in a dynamic Linux environment.. Detection as Code, Linux Security, Monitoring Tools, Detection Rules, Security Practices. . Dave Wreski
Jul 07, 2026
•
How to Learn Tips and Tricks
166
 security frameworkprocess monitoringeBPF
How to Build Behavioral Detections with eBPF on Linux
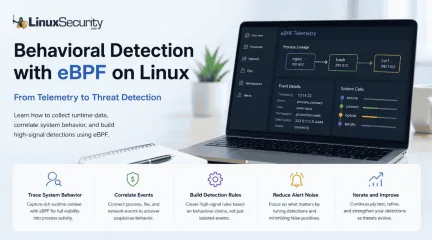
Building effective behavioral detections starts with understanding how processes behave at runtime, rather than simply collecting more logs. eBPF gives Linux security teams the visibility needed to correlate those behaviors into meaningful detections, moving away from static signatures and toward real-time analysis. . The first surprise for most people coming from auditd or legacy log collectors is how much context suddenly becomes available. Instead of just seeing that a shell executed, you also know who launched it, which container namespace it belonged to, and what it did next. That extra context is usually enough to explain why a process started in the first place. eBPF attaches to kernel events through mechanisms such as kprobes , tracepoints , and other hook types, allowing it to observe activity as it happens. You aren't parsing text logs after the fact. You are watching the system execute, which gives you low-latency runtime context. It helps capture short-lived process activity that might never make it into a traditional log file. A Practical Detection Workflow Before we dive into the mechanics, it helps to see the path. You aren't just writing rules; you're building a feedback loop. How eBPF Improves Runtime Security Visibility One thing you'll notice almost immediately is how noisy process execution becomes. A modern Linux server is constantly spawning short-lived processes you probably never realized existed. If you are a detection engineering practitioner, you know the frustration of alert fatigue: logs filled with thousands of events that tell you nothing about intent. eBPF gives you the granularity to cut through that. Much of this visibility comes from observing system calls, the interface processes use to request services from the Linux kernel. Process lineage ends up becoming one of the most valuable pieces of information you'll collect. Seeing /bin/bash execute tells you almost nothing. Seeing /bin/bash launched by nginx instead of an SSH session completely changes how you interpret that event. The command didn't change; the context did. Following that lineage across multiple generations often reveals the entire attack chain without requiring dozens of separate alerts. Choose an eBPF Security Framework You don't need to write raw C or Go code to harness this. Several frameworks sit on top of the eBPF layer. The underlying eBPF programs are doing the heavy lifting. These frameworks package that capability into rule engines, telemetry pipelines, and policy controls so you don't have to write kernel code yourself. Falco : Mature rule-based threat detection . Tetragon : Runtime policy and process-aware enforcement. Tracee : Event tracing and investigation. Cilium : Network visibility and policy for cloud-native environments. Falco is often the easiest place to start because it provides a mature rule engine and a large collection of community-maintained detections. Once you're comfortable with the telemetry, exploring tools like Tracee or Tetragon becomes much easier. Baseline Linux Monitoring Before Writing Detections Don't enable detections yet. Spend a day simply watching the telemetry. The first baseline almost always looks useless. There are hundreds of processes, package updates, scheduled jobs, and Kubernetes components doing things that initially appear suspicious. That's exactly the point. You aren't looking for attacks yet. You're learning what "Tuesday afternoon" looks like on this server. Limit your collection to events tied to process execution, network activity, sensitive file access, and namespace changes. The same approach applies to sensitive file access. Reading /etc/shadow isn't always suspicious, but who opened it, when, and what happened next often tells the real story. If you collect every available syscall , you’ll be staring at millions of records with no idea which ones matter. This is where most first-time eBPF security deployments gosideways. A common pattern is teams spending weeks writing complex detection logic before they've even collected a full day of runtime telemetry. Correlate Runtime Signals for Threat Detection Instead of monitoring isolated events, think about the "chain." An attacker’s goal is to go from entry point to a persistent foothold. Many of these behavioral chains map naturally to MITRE ATT&CK techniques, making them easier to organize and validate over time. When you capture an event, it looks something like this: Timestamp: 10:14:22 Event: process_connect Parent: nginx (PID 842) Child: /bin/bash (PID 913) User: www-data Namespace: production/web Destination: 203.0.113.5:4444 Every field here is a potential pivot point. None of these fields is particularly alarming on its own. Together, they tell a much more complete story. That's the difference between event collection and behavioral detection. Test and Tune Detection Engineering Rules Once you have a rule, verify it. Use Atomic Red Team . These are open-source scripts that mimic attacker behaviors. Run an "Atomic" test, observe the telemetry in your tool, and refine your rule. If you get a false positive, look at the parent process. Was it Ansible pushing a new configuration? Or was it apt or dnf running an unattended upgrade? If you see a legitimate process causing an alert, add an exception. Keep the exception as narrow as possible. If you just tell the system to "ignore bash," you've effectively turned off the security monitoring for that entire branch of your process tree. The Reality of False Positives You’ll see alerts for cloud-init running scripts that look suspiciously like persistence mechanisms. When that happens, your first instinct will be to write a broad ignore rule. Every allowlist entry should be specific enough that an attacker can't easily blend into legitimate activity. Also, remember container context. In a Kubernetes environment, seeing a process execute is nearly useless if youdon't know which pod, which container, and which namespace it belongs to. Always ensure your runtime security telemetry includes these metadata fields, or you’ll spend your entire day running kubectl commands just to find out which workload is generating an alert. Common eBPF Security Monitoring Mistakes Engineers often struggle with the same three mistakes during their first few months of deploying eBPF . First, they ignore the process lineage. They look at bash running a curl command and treat it as a standalone event, rather than looking at the process that spawned bash . Second, they try to treat these tools like a black-box EDR . EDR s often operate on a "install and forget" model, but eBPF provides the raw material, and it’s up to you to define what "bad" looks like. Third, they treat performance as the primary enemy. In reality, modern eBPF runtimes are hyper-efficient. The real enemy is poorly structured telemetry. If you collect everything indiscriminately, you won't have a performance problem, but you will have an "investigation" problem—you’ll be staring at a haystack trying to find a needle that wasn't indexed properly in the first place. Why Detection Engineering Rules Need Regular Tuning None of these detections are especially complex. Their value comes from the fact that they rely on behaviors attackers struggle to avoid, regardless of which malware or framework they're using. You’ll find that you stop trying to catch "everything" and start focusing on the five or six behavioral chains that represent your biggest risks. That focus is exactly what separates a noisy, unmanageable setup from a production-grade detection pipeline. Over time, you'll probably find yourself looking less at individual commands and more at the relationships between processes, users, namespaces, network activity, and file access. That's ultimately what eBPF changes. eBPF doesn't replace good detection engineering. It gives you richer runtime context, making iteasier to distinguish normal system activity from behavior that deserves investigation. Want more Linux security news, vulnerability analysis, and software supply chain updates? Subscribe to the LinuxSecurity Newsletter and get the latest threats, advisories, and expert insights delivered directly to your inbox. . Enhance Linux security with eBPF for real-time behavioral detection to identify threats and improve runtime visibility.. eBPF Linux behavioral detection security frameworks process monitoring. . MaK Ulac
Jul 01, 2026
•
How to Learn Tips and Tricks
166
 incident responselinuxsecurity analysis
How to Read Linux Audit Logs During an Intrusion
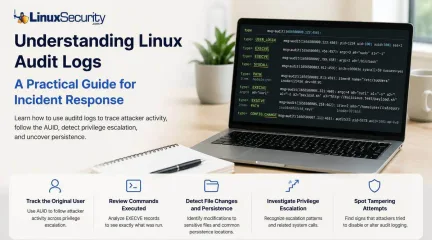
When a security alert fires, the panic often sets in before the analysis. Many administrators instinctively reach for /var/log/auth.log or journalctl , but those logs tell only a partial story. They document successful logins and authentication attempts, but they rarely capture the granular "how" of a post-compromise environment. To truly reconstruct an attack, you need to master audit logs . Unlike standard authentication logs, Linux audit logs (managed by auditd ) record system-level activity, including specific syscalls, file modifications, and command executions. In this guide, we’ll move beyond administrative documentation to show you exactly how to reconstruct an attacker’s activity during a live investigation. . Quick Incident Response Checklist Define the scope: Identify the first suspicious timestamp. Find the entry point: Search for USER_LOGIN events. Anchor the AUID: Capture the original user ID to track activity post-escalation. Trace execution: Filter EXECVE events for the auid . Audit persistence: Check for file modifications in ~/.ssh/authorized_keys or cron . Detect tampering: Inspect CONFIG_CHANGE events. Correlate: Match audit events with firewall and EDR logs. What Linux Audit Logs Reveal (The Forensic Anatomy) Before running commands, understand that auditd creates a chain of evidence. Every action (like running whoami ) generates a syscall, and every syscall is tagged with an Event ID and an auid . The auid (Audit User ID) is your "golden thread." Even if an attacker runs sudo su - to become root, their original auid remains the same. You aren't tracking a changing uid ; you are tracking the session's source. Step-by-Step: Reconstructing an Intrusion Let’s walk through a standard attack: The Compromised Session. Step A: Identify the Entry Start by searching for the login event around your alert time : Bash ausearch -m USER_LOGIN -ts 2026-06-29:02:10 -i Look for: The auid field in the output. If the auid is 1001 , every subsequent command you search for will use that specific ID. Step B: Follow the Attacker (The AUID Trail) Once you have the auid , you can ignore the uid (which will switch to 0 when they become root) and follow their specific trail: Bash ausearch -ua 1001 -i Sample Output: Plaintext type=EXECVE msg=audit(1656500000.123:456): argc=3 a0="curl" a1="-o" a2="payload.sh" ... This shows the attacker downloading a script. The auid links this activity directly to the 1001 session, even if they are currently acting as root. Step C: Identify Sensitive File Changes Attackers follow a pattern when establishing persistence or escalating. Use this table to prioritize what to investigate : File Why Attackers Target It /etc/passwd To create or alter accounts for permanent access. /etc/shadow To crack password hashes or escalate privileges. /etc/sudoers To grant themselves permanent sudo privileges. ~/.ssh/authorized_keys To maintain persistence via SSH keys. To find these, use: Bash ausearch -f /etc/sudoers -i Step D: Investigate Privilege Escalation You will often see related syscalls. When an attacker elevates privileges, look for the sequence: execve : The execution of sudo or pkexec . setuid : The transition of the effective uid to 0 . chmod / chown : Attempts to manipulate file permissions to ensure their "backdoor" remains accessible. Correlation: The Key to Context Audit logs are powerful, but they are not a standalone truth. To verify the "why," correlate them: Network Logs: If audit logs show a curl to a suspicious IP, check your firewall logs to see if that connection was successful or blocked. EDR Process Trees: Compare the pid from your audit record to your EDR telemetry to see the fullparent-child relationship of the processes. FIM (File Integrity Monitoring): If you see a file access in the audit log, verify if your FIM tool flagged the file's hash as changed. Common Investigation Mistakes Chasing the uid : Never follow the uid . It resets when an attacker uses sudo . Always stick to the auid . Missing CONFIG_CHANGE : Sophisticated attackers will run auditctl -e 0 to disable logging. If you see a gap in your logs, search ausearch -m CONFIG_CHANGE to see if the logging service was tampered with. Forgetting Timezones: Ensure your ausearch timestamps match your system's UTC or local time settings to avoid missing the window. Final Thoughts The next time an alert fires, don’t stop at the authentication logs. Audit logs can reveal every command an attacker executed, every sensitive file they touched, and every privilege escalation path they navigated. By shifting your focus from "did they log in?" to "what did they do after they logged in?", you transform audit logs from simple compliance records into a high-fidelity forensic trail. Are you ready to harden your environment? Subscribe to the LinuxSecurity Newsletter for upcoming tutorials on writing custom audit.rules and building automated detection logic for your SIEM. Related Reading Auditd vs eBPF: Effective Strategies for Modern Linux Monitoring Linux Logs Often Miss Critical Attack Details and Detection Gaps Understanding Log Management and Analysis Tools for Linux Systems Effective File Integrity Monitoring Techniques for Linux Systems Understanding Linux Persistence Mechanisms and Detection Tools Linux EDR: Essential Tool for Cybersecurity and Incident Response . Learn how to analyze Linux audit logs to uncover activity during security incidents and strengthen your incident response.. Linux Audit Logs, Incident Response, Security Analysis, Intrusion Forensics, System Activity Tracking. . MaK Ulac
Jun 29, 2026
•
How to Learn Tips and Tricks
166
 security advisorylinuxdocker
GitHub Actions Linux Self-Hosted Runners Security Risks 2025-30066
Self-hosted GitHub Actions runners give organizations far more flexibility than standard cloud-hosted runners. Teams can integrate internal infrastructure directly into CI/CD workflows, automate Kubernetes deployments, run custom tooling, and manage Linux-based build environments without relying entirely on external infrastructure. . That flexibility also creates a significant security risk. A compromised self-hosted GitHub Actions runner can hand attackers direct access to Kubernetes clusters, cloud credentials, package registries, and production deployment systems—often without exploiting a single Linux vulnerability. Recent compromises, such as the poisoning of the tj-actions/changed-files Action and the Codecov supply chain breach, demonstrated how attackers increasingly target CI/CD automation. This is because the pipeline itself often provides privileged access to infrastructure and production environments already. Unlike ephemeral cloud runners, self-hosted Linux runners frequently persist long after workflows complete. In many environments, they already sit close to Kubernetes clusters, internal repositories, package publishing systems, and cloud administration tooling. Why Self-Hosted GitHub Actions Runners Create Security Risks Self-hosted runners often inherit broad operational access because they handle container builds, infrastructure deployment, cloud provisioning, and release automation simultaneously. That concentration of privileged access makes the runner itself a high-value target. As workflows expanded, self-hosted runners gradually accumulated access to: cloud deployment credentials, Kubernetes environments, internal repositories, package publishing systems, infrastructure automation tooling, container registries, and production release pipelines. The risk becomes larger when organizations place runners directly inside trusted internal networks or allow workflows to interact directly with production infrastructure. Once attackerscompromise the workflow environment, the runner may become a pivot point for lateral movement deeper into the environment. Unlike traditional endpoint compromise, attackers frequently abuse legitimate CI/CD automation behavior rather than exploiting Linux directly. That operational normalcy makes malicious workflow activity much harder to detect. How to Use Ephemeral GitHub Actions Runners on Linux Persistent runners may retain credentials, temporary artifacts, shell histories, and environment variables long after workflows finish executing. That persistence creates additional opportunities for: credential theft, workflow persistence, artifact tampering, and lateral movement across infrastructure environments. Ephemeral runners reduce that exposure window because the environment is destroyed automatically after each workflow completes. If you are running on standalone Linux hosts, you can enforce this by using the --ephemeral flag during the registration process: ./config.sh --url [https://github.com/OWNER/REPO](https://github.com/OWNER/REPO) --token YOUR_TOKEN --ephemeral Many organizations now deploy ephemeral Linux runners using the GitHub Actions Runner Controller (ARC) for Kubernetes. This allows organizations to isolate workflows using namespaces, network policies, and tightly scoped service accounts. The goal is to prevent attackers from inheriting leftover state between jobs. How to Restrict Docker Socket Access on GitHub Actions Runners Exposing the Docker socket ( /var/run/docker.sock ) inside GitHub Actions workflows effectively grants root-level control over the runner host. Many Linux CI/CD environments expose this socket so pipelines can build containers directly, but that configuration becomes dangerous during workflow compromise because attackers may use Docker socket access to escape container isolation, mount sensitive host directories, or deploy privileged containers. Organizations should avoid exposing the Docker socket whenever possible.Safer alternatives include: rootless container builds, isolated build systems, BuildKit, or Kaniko. A standard Kaniko implementation in a Kubernetes-based runner looks like this: YAML - name: Build with Kaniko image: gcr.io/kaniko-project/executor:latest args: ["--dockerfile=Dockerfile", "--destination=my-registry.com/image:latest"] How to Remove Long-Lived Secrets From GitHub Actions Workflows Long-lived credentials create unnecessary exposure. Many workflow compromises specifically target GitHub Personal Access Tokens or cloud access keys stored inside repositories. Once exposed, those credentials may continue functioning long after defenders discover the breach. Organizations should replace static credentials with OIDC (OpenID Connect) . OIDC allows workflows to request temporary cloud credentials dynamically during execution. Major cloud providers, including AWS, Azure, and Google Cloud, already support OIDC integration, which significantly reduces the operational value of stolen credentials. A hardened OIDC configuration for AWS would look like this: YAML permissions: id-token: write contents: read steps: - name: Configure AWS Credentials uses: aws-actions/configure-aws-credentials@v4> with: role-to-assume: arn:aws:iam::1234567890:role/my-github-role aws-region: us-east-1 How to Restrict GitHub Actions Workflow Permissions Many GitHub Actions environments still run with broader repository permissions than workflows actually require. Overly permissive configurations, such as permissions: write-all , grant workflows unnecessary repository modification privileges. A safer baseline starts with an empty permission set, explicitly granting only the permissions required for the workflow itself: YAML permissions: {} # Grant only the specific scope required permissions: contents: read Security teams should also carefully review all workflows using the pull_request_target trigger. Because thistrigger executes using the permissions of the target repository rather than the untrusted fork, attackers may abuse it to expose repository secrets. How to Review GitHub Actions Workflow Changes Safely Workflow files should be treated like infrastructure code. Modifications inside .github/workflows/ can directly affect deployment systems, cloud authentication, and runner execution behavior. Organizations should require mandatory pull request reviews and use CODEOWNERS protection to ensure security teams audit every change. Plaintext # .github/CODEOWNERS .github/workflows/ @platform-security-team In many environments, modifying a workflow effectively changes production infrastructure behavior. Security teams should monitor for unexpected workflow additions or unauthorized permission changes that could indicate a supply chain compromise in progress. How to Restrict Outbound Traffic and Monitor Activity Many CI/CD compromises rely on transmitting secrets to attacker-controlled infrastructure. Organizations should restrict unnecessary outbound traffic from runners using firewall rules, DNS filtering, or Kubernetes NetworkPolicies . For example, you can lock down a Kubernetes runner pod to only communicate with GitHub IP ranges: YAML apiVersion: networking.k8s.io/v1 kind: NetworkPolicy metadata: name: runner-egress spec: podSelector: matchLabels: app: github-runner egress: - to: - ipBlock: cidr: 140.82.112.0/20 # GitHub IP Range Because attackers frequently operate using legitimate workflow credentials, detection often depends on identifying unusual operational behavior—such as unexpected curl execution or unauthorized cloud API activity. GitHub Actions Runner Hardening Checklist Use ephemeral runners to prevent persistence between builds. Replace long-lived cloud credentials with short-lived OIDC tokens. Remove Docker socket exposure by using Kaniko or BuildKit. Isolate runners from productionnetworks and Kubernetes control planes. Restrict outbound traffic to only essential GitHub and cloud endpoints. Enforce a "deny-all" permission baseline in every workflow YAML. Require mandatory reviews for any modification to .github/workflows/ . GitHub Actions workflows now sit directly inside the software supply chain. They build applications, publish packages, and deploy infrastructure across production systems every day. That operational position makes them extremely attractive targets. For Linux-heavy infrastructure running cloud-native workloads, the risk is significant because the pipeline is no longer just a support tool—it has become part of production itself. Want more Linux security hardening guides like this? Subscribe to our newsletter for practical tutorials on Linux infrastructure, CI/CD security, cloud-native operations, and open-source security best practices. . Self-hosted GitHub Actions runners offer flexibility but pose major security risks that organizations must address effectively.. Self-hosted GitHub, Actions runners, CI/CD security, Linux infrastructure, pipeline security. . MaK Ulac
May 15, 2026
•
How to Learn Tips and Tricks
166
 security advisorysystem upgradeupdate process
Updating & Upgrading Linux Distributions: Essential Security Practices
Applying security updates promptly after they are released is critically important for us Linux admins, as this practice helps protect against vulnerabilities that malicious actors could exploit. Failing to update could expose your Linux systems to cyberattacks, data breaches, and other severe security risks. . In this article, I'll guide you through checking installed versions of packages and performing security updates on popular Linux distributions, including Ubuntu, Fedora, Debian, Arch Linux, and openSUSE, thus reducing potential risks that could threaten the security and availability of your systems and your critical data. This is precisely the type of resource I was seeking as a junior sysadmin, and I hope these instructions will help make your Linux administration journey simpler and safer when you need to upgrade Linux. Let’s get started! What Are the Implications of Continuing to Use a Linux Distro Beyond Its Supported Date? Using a Linux distro past its supported date leaves your system unpatched, unsupported, and increasingly vulnerable to new security threats. Running a Linux distro beyond its supported date is risky for any admin. Once a distribution has reached its end of life (EOL), it no longer receives security updates, patches, or bug fixes. This leaves your system vulnerable to new security threats that won't be addressed. Over time, this lack of updates can lead to compatibility issues with newer software, which might require dependencies that won't be updated on EOL systems. In practice, it also means that if you encounter any problems, getting help from the community or official support channels will be much harder as the focus shifts to newer, supported versions. Running outdated software can also have compliance implications, especially in regulated industries where maintaining updated and secure systems is required. As a sysadmin, planning and scheduling regular upgrades is crucial to avoid downtime and ensure your systems remain safe and supported. Thisinvolves staying aware of your distro’s release and support schedules, testing new versions in staging environments, and having a clear upgrade path so you’re never caught off guard by an expired support window. Once repositories age out or metadata stops receiving updates, hash mismatches and signature failures also become more common, making it necessary to fall back on standard Linux integrity verification methods to validate files directly. Updates vs. Upgrades: Understanding the Difference While seemingly similar, updating and upgrading a Linux distribution refer to different operations within the context of system maintenance. Understanding this difference is a key part of preventing system drift in Linux and maintaining a stable environment. Updating a Linux distribution typically involves fetching and installing the latest versions of the installed software packages from the repositories. When you run an update command (such as sudo apt-get update or apt update ), the package manager syncs the local list of available packages with the remote repositories. After running apt-get upgrade or apt upgrade , the system retrieves and installs the updated versions of the packages without changing any major versions of the operating system itself. In contrast, upgrading a Linux distribution usually means moving to a newer version of the distribution itself. This involves more significant changes and can include new features, new kernel versions, and more up-to-date software stacks. In Debian-based systems, this is often performed using commands like apt-get dist-upgrade or do-release-upgrade , which handle complexities beyond simple package updates like dependencies and system configuration changes. Benefits of Updating Packages Manually vs. Relying on Automatic Updates Manual updates offer several advantages, such as selective control, allowing admins to prioritize critical security patches while avoiding updates that could disrupt existing configurations. They alsoenhance change management by letting updates be scheduled during maintenance windows, minimizing downtime, and enabling testing in staging environments before deployment. This ensures smoother operation and reduced risk. Additionally, manual updates provide customization options tailored to the system's specific needs, ensuring optimal performance. They also foster increased security awareness, as staying hands-on with updates keeps admins informed about the latest vulnerabilities and mitigations. Collectively, these benefits enable us admins to maintain a robust, secure, and well-managed environment suited to our operational requirements. How To Enable Automatic Updates for Your Linux Distro Should you choose to enable automatic updates for your Linux distro, here's a practical guide for doing so. This will ensure your systems are consistently updated with the latest security patches and improvements. Follow these steps for Ubuntu, Fedora, Debian, Arch Linux, and openSUSE to streamline your update process. Ubuntu First, install Unattended-Upgrades: sudo apt install unattended-upgrades Then enable it: sudo dpkg-reconfigure --priority=low unattended-upgrades Edit: /etc/apt/apt.conf.d/50unattended-upgrades Ensure required lines such as: "origin=Debian,codename=${distro_codename}-security"; are uncommented. Optional auto-removal: Unattended-Upgrade::Remove-Unused-Dependencies "true"; Configure periodic updates in: /etc/apt/apt.conf.d/20auto-upgrades Add: APT::Periodic::Update-Package-Lists "1"; APT::Periodic::Unattended-Upgrade "1"; Fedora Install DNF-Automatic: sudo dnf install dnf-automatic Edit: /etc/dnf/automatic.conf Set: apply_updates = yes Enable the timer: sudo systemctl enable --now dnf-automatic.timer Debian Install Unattended-Upgrades: sudo apt install unattended-upgrades Enable it: sudo dpkg-reconfigure --priority=low unattended-upgrades Edit: /etc/apt/apt.conf.d/50unattended-upgrades Set schedule in: /etc/apt/apt.conf.d/20auto-upgrades Add: APT::Periodic::Update-Package-Lists "1"; APT::Periodic::Unattended-Upgrade "1"; Arch Linux Install cron: sudo pacman -S cronie Enable cron: sudo systemctl enable --now cronie Add a cron job: crontab -e 0 3 * * * sudo pacman -Syu --noconfirm Or configure a systemd timer with: /etc/systemd/system/pacman-update.timer /etc/systemd/system/pacman-update.service Enable timer: sudo systemctl enable --now pacman-update.timer openSUSE Install automatic updates: sudo zypper install zypper-automatic Edit: /etc/zypp/zypp.conf Set: autoupdater=true Enable timer: sudo systemctl enable --now zypper-automatic.timer How Can I Upgrade Ubuntu & Update Packages? You can upgrade Ubuntu by updating your package lists, upgrading installed packages, and running the release upgrade tool. Check Installed Version: dpkg -s | grep Version Update package list: sudo apt update Upgrade an individual package: sudo apt install --only-upgrade Upgrade Linux (Ubuntu): sudo apt update && sudo apt upgrade -y && sudo apt dist-upgrade Clean up: sudo apt autoremove && sudo apt clean Release upgrade: sudo do-release-upgrade Clarification: apt upgrade installs routine package updates, while apt full-upgrade and apt-get dist-upgrade can remove or replace packages to complete a full system transition. Ubuntu Release Schedule Ubuntu has a two-year release cycle , and LTS, or 'Long Term Support, ' releases are published in April. Ubuntu has both Long-Term Support (LTS) releases and interim releases. For desktop and server versions, LTS versions are supported for 5 years, while interim releases are supported for 9 months. How Can I Upgrade Fedora & Update Packages? You can upgrade Fedora by updating packages, installing the system-upgrade plugin, downloading the newrelease, and rebooting to apply the upgrade. Check version: rpm -q Update package: sudo dnf update Upgrade Fedora: sudo dnf install dnf-plugin-system-upgrade sudo dnf system-upgrade download --releasever=XX sudo dnf system-upgrade reboot Fedora Release Schedule Fedora releases two major OS versions each year, aiming for the fourth Tuesday in April and October. Each release is supported for approximately 13 months. How Can I Upgrade Debian & Update Packages? You can upgrade Debian by updating package lists, upgrading current packages, updating your sources list to the next release, and completing a full upgrade. Check version: dpkg -s | grep Version Update package list: sudo apt update Upgrade individual package: sudo apt install --only-upgrade Upgrade Debian: sudo apt update && sudo apt upgrade -y && sudo apt full-upgrade Edit sources: /etc/apt/sources.list Replace the old codename with the new release. Finish upgrade: sudo apt update sudo apt upgrade sudo apt full-upgrade sudo reboot Debian Release Schedule Debian releases do not follow a fixed schedule. The Debian Project has released recent versions roughly every two years. Regular Debian releases are supported for about 3 years after the initial release, while LTS releases are supported for 5 years through the Long-Term Support project. How Can I Upgrade Arch Linux & Update Packages? You can upgrade Arch Linux by checking installed package versions and running a full system upgrade using pacman. Check version: pacman -Qi | grep Version Update package: sudo pacman -S Upgrade system: sudo pacman -Syu ArchLinux Release Schedule Arch Linux does not have a formal release schedule or a predetermined support timeline. Instead, the distro uses a "rolling release" system where new packages are released throughout the day. Its package management allows users to easily keep systems updated. Thereis no fixed support period as new packages and updates are regularly provided. How Can I Upgrade openSUSE & Update Packages? You can upgrade openSUSE by refreshing repositories, updating installed packages, and performing a distribution upgrade with zypper. Check version: rpm -q Update package: sudo zypper update Upgrade system: sudo zypper refresh sudo zypper update sudo zypper dist-upgrade openSUSE Release Schedule openSUSE Leap Micro is released twice a year and receives maintenance updates approximately every 12 months. openSUSE Leap is supported for about 18 months per minor release or until the next minor release. openSUSE Tumbleweed is a rolling release and is continuously updated without a fixed support period. These steps will help you upgrade each of the listed Linux distributions to their latest versions. Always ensure you have backups of your important data before upgrading. Our Final Thoughts on the Importance of Timely Linux Security Updates Maintaining up-to-date Linux distributions with security patches and software upgrades is not only a best practice but also a necessary measure to protect your systems against potential threats. We’ve provided detailed instructions for checking and updating existing packages across popular distributions. Follow these steps to ensure your system remains robust and less susceptible to attacks. Regular updates and a disciplined cybersecurity approach help maintain operational integrity. Always back up important files before upgrading. Stay informed on the latest vulnerabilities, patches, and Linux security developments by following our live updates in the Linux Security News Hub . . Explore essential steps for updating and upgrading Linux distros to enhance security and maintain system integrity.. applying, security, updates, promptly, released, critically, important, linux. . Brittany Day
Nov 19, 2025
•
How to Learn Tips and Tricks
166
 security advisoryintrusion detectionaccess control
Elevate Linux Security in 2024 with Advanced Tools and Strategies
As we navigate 2024, the cybersecurity landscape continues to shift and evolve at an ever-increasing pace, increasing in sophistication as open-source environments gain popularity. This trend makes it imperative for administrators and organizations to stay ahead of emerging threats with cutting-edge security tools and strategies. . In this article, I'll guide you through increasing Linux security using cutting-edge tools and technologies designed to protect against advanced and emerging threats. Let's begin by examining the modern Linux security landscape. Understanding the Current Linux Security Landscape Despite their strong security track record, Linux systems remain susceptible to threats such as unpatched software, server misconfiguration, and inadequate endpoint protection. Furthermore, their inherent complexity and the use of third-party applications increase their vulnerability and risk of breaches. Open-source systems, including Linux, have seen an upsurge in targeted cyberattacks by threat actors exploiting vulnerabilities and creating sophisticated malware for Linux systems to attack critical infrastructures. This trend underscores the necessity of keeping vigilant and adopting advanced security solutions. Evaluating Your Linux Security Needs Assessing your Linux environment thoroughly is the first step toward fortifying its defenses. Tools like Lynis can assist with this endeavor by helping identify misconfigurations, out-of-date software installations, and other potential weaknesses in your system. An in-depth security audit identifies vulnerabilities within your system and prioritizes enhancement needs. Identifying critical assets—from customer data to intellectual property—is paramount to implementing tailored security measures that best protect them. High-value targets require multilayered approaches incorporating perimeter defenses, intrusion detection systems, and endpoint protection measures for maximum protection. Advanced Intrusion Detection Systems(IDS) for Linux Intrusion detection systems are indispensable tools for monitoring and analyzing network traffic for signs of malicious activity. In 2024, IDS technologies have become even more sophisticated, with Artificial Intelligence (AI) and Machine Learning integration providing improved anomaly detection and response times. Integration Tips for Snort and Suricata on Linux Systems Snort and Suricata are two prominent IDS solutions for Linux. To integrate Snort into your systems: Install Snort: Use package managers like APT (Debian/Ubuntu) or YUM (CentOS) to install it. Configure Detection Rules: Customize rules based on your network environment. Set Up Logging and Alerting: Ensure logs are correctly configured to alert for suspicious activities. For Suricata: Install Suricata: Follow similar installation steps using package managers. Configure YAML File: Tailor the suricata.yaml configuration file to your network specifics. Enable Emerging Threats Rules: Utilize community-contributed rules for enhanced detection. Automated Vulnerability Scanners and Their Integration Automation in vulnerability management drastically shortens the timeline from vulnerability identification to remediation. Tools like OpenVAS and Nessus automate scanning, rating vulnerabilities, and proposing remedies. Incorporating OpenVAS and Nessus in Your Systems To integrate OpenVAS: Install OpenVAS: Follow installation guides tailored for your distribution. Configure Scans: Schedule regular scans tailored to your environment. Analyze Reports: Use the detailed reports to prioritize and address vulnerabilities. For Nessus: Install Nessus: Download and install from the official site. Create Scan Policies: Customize policies for regular and ad-hoc scans. Review Results: Utilize built-in suggestions for remediation. Enhancing Access Control with SELinux and AppArmor SELinux and AppArmor providemandatory access controls, limiting what processes can do based on defined policies. To configure SELinux: Set Enforcing Mode: Enable SELinux in enforcing mode. Write Custom Policies: Develop policies tailored to your applications. Audit Logs: Regularly review logs for denied actions and adjust policies accordingly. For AppArmor: Install and Enable: Ensure AppArmor is installed and enabled. Create Profiles: Develop profiles for applications. Monitor Alerts: Use tools like aa-logprof to review and update profiles based on observed behaviors. Case Studies on Effective Enforcement Policies Organizations like Red Hat use SELinux to isolate services, blocking lateral movement in case of a breach. AppArmor is effectively used in Ubuntu to confine applications like MySQL , reducing their attack surface. Our Final Thoughts on Using Cutting-Edge Tools to Improve Linux Security Proactive security measures are crucial for Linux environments in the face of ever-evolving cybersecurity threats. Admins can build resilient defenses by integrating cutting-edge tools such as advanced IDS, automated vulnerability scanners, next-gen endpoint protection, and AI-driven solutions. Community-driven open-source projects further enhance security, offering collaborative defense mechanisms. Stay informed, continuously adapt, and engage with the broader security community to safeguard your Linux environment against future challenges. Your vigilance and proactive measures today will profoundly impact your overall security posture tomorrow! . Enhance Linux security in 2024 with advanced tools, strategies, and proactive measures to combat emerging threats.. navigate, cybersecurity, landscape, continues, shift, evolve, ever-increasing. . Anthony Pell
Sep 30, 2024
•
How to Learn Tips and Tricks

Get the latest News and Insights
Get the latest Linux and open source security news straight to your inbox.
Community Poll
Is continuous patching actually viable?
Search Topics
Powered By

Linux Security - Your source for Top Linux News, Advisories, HOWTOs and Feature Releases
QUICK LINKS
subscribe to newsletters!
Like staying secure? So do we.
Sign up for updates, tips, and alerts!