Overly broad permissions can turn one compromised account into a much larger security problem. Learn how to reduce unnecessary access, review privileges, and apply least privilege across modern Linux systems. Review Linux Privileges×


Stay Ahead With Linux Security HOWTOs
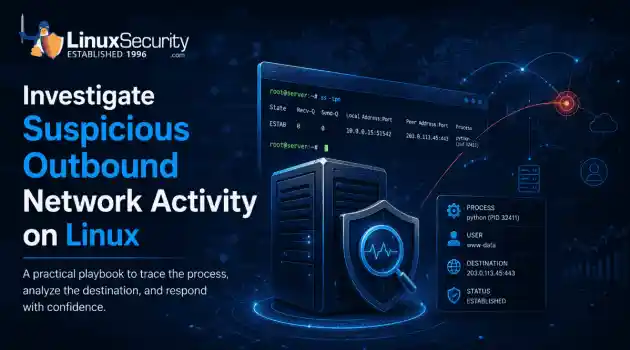
How to Secure My Network incident response network traffic
incident response network traffic Imagine logging into a production Linux server for routine maintenance and noticing background network activity connecting to an unfamiliar external IP address. Your endpoint protection agent is not popping up with an alert, there is no service failure, and on the surface, the system appears to be running normally. . For Linux administrators and security teams, such a situation is a moment of truth: Is this activity a sign of active intrusion or just a tool that was overlooked in the course of...
 Jul 21, 2026

How to Harden My Filesystemsystem hardening open source security
system hardening open source security We all spend a lot of time defending our systems from external threats, but the amount of damage an attacker can cause often depends on what happens after they get in. A single compromised account doesn't always lead to a major incident. The real danger begins when that account has far more access than it actually needs. . That's exactly what the principle of least privilege is designed to prevent. By limiting users, services, and applications to only the permissions required for their jobs,...
Jul 20, 2026

How to Learn Tips and Tricksthreat detection system monitoring
threat detection system monitoring For small security and IT teams, the "enterprise" dream of a fully automated SIEM often feels like a distant luxury. It’s a vision built on massive budgets and dedicated engineering teams—things that, frankly, most of us don't have. But here is the reality: you don’t need a six-figure platform to maintain a secure environment. . Linux systems are, by design, incredibly verbose. Every time a user authenticates, a process executes, or a configuration file changes, your system creates a record of...
Jul 17, 2026
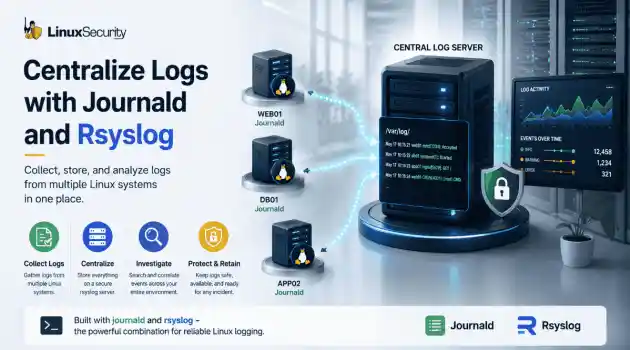
How to Learn Tips and Tricksnetwork security centralized logging
network security centralized logging Linux systems generate a steady stream of authentication, service, kernel, and application logs. On most systems, those logs never leave the machine that created them. If you're responsible for ten or twenty servers, that means checking each one separately. If one disappears before you can investigate it, its logs may disappear with it. Centralized logging solves that by sending log messages to another server as they're created. Instead of searching every machine, you have one place to review...
Jul 15, 2026

How to Secure My Networksecurity advisory audit
security advisory audit When you’re digging through an incident, your logs are the only thing you can actually trust. The problem is, attackers know that too. If someone gets root on your server, their first move is almost always to delete the evidence and cover their tracks. . If you aren't actively protecting your logs, you're basically flying blind the second a breach happens. It’s a miserable feeling to realize you have no idea what an attacker did because they wiped the logs before you even got there. In this...
Jul 11, 2026
 Refine HOWTOs
X Clear Filters
Get the latest News and Insights
Get the latest Linux and open source security news straight to your inbox.
Community Poll
Should Linux servers automatically install security updates?
Loading...
Explore Latest Linux Security HOWTOs
We found 8 articles for you...
167
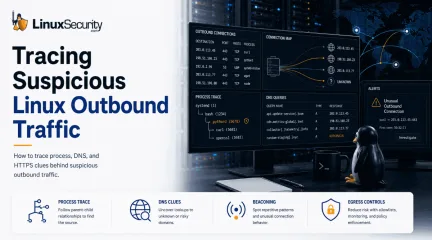 network monitoringLinux serversecurity investigation
How to Diagnose Suspicious Outbound Connections on Linux Servers
When a Linux server initiates an unauthorized outbound connection to an unknown IP address, it rarely triggers an immediate system failure. Instead, the server continues running normally, and the connection is usually only discovered during a routine firewall log review, a DNS audit, or a post-incident investigation. Because there are no obvious system crashes or performance drops, these quiet outbound sessions can easily be overlooked. . However, treating these anomalies lightly is a significant security risk. While an unexpected connection might simply be a misconfigured monitoring agent, a new package repository, or a developer's temporary test script, it can also be the first warning sign of a compromised host. Once attackers gain access to a server, they rely on outbound connections to download malicious tools, receive commands from a command-and-control server, or exfiltrate sensitive data. To secure your environment, you cannot rely on guesswork. When a server communicates in a way that contradicts its defined role, you must systematically investigate the traffic, isolate the specific local process responsible, and determine whether the connection is legitimate or malicious. Why Does Outbound Traffic Matter on a Linux Server? Most Linux hardening discussions focus on what can reach the server. SSH exposure, open ports, web application attacks, firewall rules, and failed logins. That is still important, but it only covers one side of the problem. Once a server is compromised, the attacker often needs the server to call out. That outbound connection may be used to: Download a tool Receive commands Resolve attacker-controlled infrastructure Send stolen data Keep a quiet foothold alive It may look like normal HTTPS or DNS because those protocols are already common in most environments. The practical question is not “Is outbound traffic bad?” Linux servers need outbound access for real work. The question is whether this specific server, running this specificprocess under this specific account, should connect to that destination at that time. NOTE : A web server connecting to an internal API may be expected. The same web server connecting to an unknown VPS provider from a PHP child process is different. A CI runner talking to registries and cloud APIs may be normal. A database host making repeated HTTPS requests to random domains should get attention fast. What Should You Check First? 1. Start with the server’s purpose This sounds basic, but it prevents wasted time. Before chasing an IP reputation score, ask what the host is supposed to do. A DNS resolver, mail relay, Kubernetes node, Git runner, web server, database server, and backup appliance all have different normal traffic. You cannot judge the connection without that context. 2. Identify the local process This is where the investigation becomes concrete. An unknown IP address is vague. A process name, user account, parent process, and binary path give you something to work with. A quick live check may start with: Bash ss -tunap lsof -i -n -P Use those as snapshots, not proof. Short-lived connections may be gone before you run the command. On busy hosts, the output can also be noisy. Still, when the connection is active, these commands often tell you whether you are looking at a normal daemon, an admin session, a script, or something that should not be there. The useful details are simple: Process name and PID Local user Remote address and port Whether the connection is established or only briefly appears Write them down. Do not trust memory during an incident. How Do You Decide Whether the Process Makes Sense? The process should fit the server’s job. That is the main test. What makes sense: A package manager reaching a known repository during a patch window, a backup agent connecting to its configured backup target, or a monitoring daemon sending data to the monitoring platform. Those still need validation, but they are atleast plausible. What raises suspicion: When the process does not belong in the network path. Shells, interpreters, and temporary binaries should not usually be opening unexplained outbound connections from production servers. There are exceptions, but exceptions should have owners. Look closely at processes like bash, sh, python , perl, php, node, curl, wget, and unknown binaries in writable paths. A script in /opt/company/scripts/ may be part of operations. A binary in /tmp or /dev/shm with an ordinary-looking name is a different conversation. Parent process matters: curl launched by a known deployment job is one thing. curl launched by a web server worker is another. python running from an application virtual environment may be normal. python running from an upload directory after a suspicious web request is not normal at all. Do not stop at the process name. Attackers rename files. A process called systemd-update is not trustworthy just because the name looks familiar. Check the path, ownership, command line, start time, and parent. What Does Beaconing Look Like in Practice? Beaconing is repeated outbound contact. A compromised host checks in with an external system, often with small amounts of data. Sometimes it happens every minute. Sometimes every hour. Sometimes the timing shifts slightly to avoid looking too mechanical. In practice, beaconing often looks boring. That is the trick. You may see the same server contacting the same destination again and again. The traffic may be small. The connection may close quickly. DNS may happen right before the connection. The process may sleep, wake up, connect, then disappear or go quiet. This is where older logs help. A live command only shows what is happening right now. Firewall logs, proxy logs, DNS logs, and process logs show whether this is a pattern. One strange connection may be a test or a failed update. A repeated pattern from the same odd process needs more care. Do not assume slow meanssafe. A server that checks in every six hours can still be under control. Some attackers prefer slow traffic because it blends into normal background noise. On Linux servers that run for months without rebooting, a quiet callback can live a long time. The practical move is to line up timestamps. When did the outbound traffic start? Did it begin after a: Package install or deployment? New container image? Admin login or failed SSH burst? Web exploit attempt? File modification? Timing often gives the first real lead. How Should You Investigate Suspicious DNS Activity? DNS is one of the best places to look because many command channels need name resolution, and some abuse DNS directly. It is also noisy. That means you need patterns, not one-off panic. Check the Resolver Path In many environments, Linux servers should send DNS to internal resolvers, not random public DNS servers. If a production host is querying outside resolvers directly, find out why. It might be a container setting, a hardcoded application resolver, a VPN tool, or a misconfiguration. It might also be deliberate bypassing. Analyze the Queries Look at the names being queried. Very long subdomains, random-looking strings, repeated failed lookups, unusual TXT lookups , and many queries from one host can all matter. Long subdomains are especially worth checking because data can be packed into DNS labels. TXT records deserve a second look. They are legitimate, but they can also carry flexible data. If a server starts making repeated TXT lookups to a domain nobody owns internally, do not hand-wave it. Watch for DNS over HTTPS (DoH) DNS over HTTPS adds another wrinkle. It hides DNS queries inside HTTPS traffic. That may be common on some desktops, but most Linux servers do not need it unless the environment intentionally uses it. If a server is running a DoH client and nobody can explain it, treat that as a finding even before proving malware. The goal is not to block every strange domain onsight. First, connect the DNS activity back to a process or workload. DNS from the system resolver during a package update is different from DNS generated by a script in a writable directory. Why Is HTTPS Still Useful to Investigate? HTTPS hides content, but it does not hide everything. You can still learn from the process, destination, timing, amount of data, and whether the traffic fits the server. Most attacker-controlled traffic today can look like web traffic. That does not make investigation impossible. It just means admins need to stop expecting payload visibility to answer every question. For suspicious HTTPS, focus on what you can prove: Which process opened the connection? Which user ran it? Was there a DNS query first? Did the connection repeat? Was more data sent than received? Did it start after a new file appeared? Does the destination match anything in the application configuration? A small HTTPS request from a strange process can be more important than a large transfer from a known backup job. Size alone does not decide severity. Context does. Be careful with cloud destinations. An IP owned by a major cloud provider does not make the traffic safe. Attackers use the same platforms everyone else uses. Object storage, paste services, temporary hosting, and developer platforms are common places to stage tools or receive data. This is also where outbound allow rules can become too loose. “Allow HTTPS anywhere” is operationally convenient. It also gives compromised systems a clean way out. Some servers need broad egress. Many do not. How Do You Tell Normal Admin Work From Something Bad? This is where Linux experience matters. Real environments are messy. A cron job may call a script with curl. A monitoring plugin may run under a service account. A backup agent may connect to a vendor endpoint. A container may resolve domains the host owner does not recognize. Ugly does not always mean hostile. The difference is whether the behaviorcan be explained and owned. Normal admin work usually has a trail: a ticket, a package, a systemd unit, a cron entry, a deployment, a known script path, or a person who says, “Yes, that is ours.” Compromise often has gaps. Nobody owns it. The path is odd. The parent process is strange. The timing lines up with suspicious activity. Do not accept weak explanations too quickly. “It is probably monitoring” is not enough. Which agent? Which config? Which destination? Which account? When was it installed? Why did it start now? A practical classification helps: Expected and documented Expected but poorly documented Unwanted misconfiguration Unexplained and under review Suspicious enough to contain Most incidents do not start with certainty. They start with a pile of details that either begin to make sense or get worse the longer you look at them. What Local Persistence Should You Check? On Linux, persistence does not need to be advanced. Cron still works. Systemd services and timers work. User-level systemd units work. Shell profile files, init scripts, application hooks, and modified service files also show up often enough to check. Look at the obvious places first. It is not glamorous, but it catches real issues. System Tasks: Review cron entries for root and relevant service accounts. Check systemd units and timers created or modified around the time the traffic began. File Paths: Look for scripts in writable directories. Review recently changed files in application paths. Check whether a web process wrote files it should not have written. Web Servers: Inspect upload directories, plugin directories, cache directories, temporary paths, and application-specific writable folders. A small web shell may be enough to start outbound connections. The network symptom may be the second thing you notice, not the first. CI and Automation Servers: Be more aggressive. These systems often hold secrets and have broad outbound access by design. Asuspicious connection from a build runner may indicate token theft or pipeline abuse, not just a compromised host. What Should You Do Before Killing the Process? Do not erase the evidence too early; it’s a common mistake. If the connection looks active and risky, containment may be urgent. But before killing processes or deleting files, capture enough detail to understand what happened. Even a quick note is better than nothing. At a minimum, collect: Process name, PID, and command line User and parent process Binary path and open network connection Destination, start time, and related DNS names Save relevant logs. Hash suspicious files before removing them if practical. Blocking outbound traffic is often safer than immediately destroying the process. A firewall rule, proxy block, security group change, or network policy can stop the callout while leaving the host available for review. That is not always possible, but it is worth considering. If the server is high value, assume credentials may be exposed. Rotate keys and tokens that lived on the host. Review SSH keys, cloud credentials, database passwords, deployment tokens, and application secrets. Attackers often use the first compromised server as a way to reach better systems. Rebuilding may be the right answer after the investigation. But rebuild from known-good sources, not from the same compromised state. Otherwise, you are just reinstalling the problem. How Can You Make This Easier Next Time? The best time to define normal outbound traffic is before an alert. The second-best time is after the first painful investigation. Start with server roles: A database server should have a short list of expected outbound needs. A web server may need APIs, DNS, logging, monitoring, and package repositories. A CI runner may need much more. That difference should be documented somewhere that admins actually use. Log Retention: Keep DNS logs long enough to investigate. Keep firewall or proxy logs longenough to see patterns. Where possible, collect process start information so a network connection can be tied back to a local process. Without that link, every investigation takes longer. Egress Controls: Egress controls help when they are realistic. Blocking all outbound traffic sounds clean until patching, logging, backups, and cloud integrations break. A better approach is role-based egress. Servers get the outbound access they need, not a default path to the whole internet. Review Exceptions: Old allow rules are where risk collects. A temporary “allow HTTPS anywhere” rule for troubleshooting often becomes permanent because nobody removes it. Attackers like permanent temporary rules. What Linux Admins Should Keep in Mind Suspicious outbound traffic is a reasoning problem, not just a command problem. The commands help, but the answer comes from context. Start with the server’s job. Find the process. Check the user account, parent process, path, timing, destination, and DNS behavior. Then decide whether the traffic fits what the server is supposed to be doing. DNS and HTTPS deserve special attention because they are normal enough to hide inside. Long DNS queries, direct external resolver use, odd TXT lookups, repeated small HTTPS sessions, and outbound traffic from shells or interpreters are all worth slowing down for. Do not dismiss strange traffic because the server still works. Many compromised Linux systems keep doing their normal job while quietly doing something else. That is why outbound investigation matters. The working rule is plain enough: unknown outbound traffic is not proof of compromise, but every unexplained connection should eventually become explained, contained, or removed. Stay Ahead of Linux Security & Infrastructure Trends Interested in more in-depth coverage of Linux server monitoring, outbound traffic analysis, firewall behavior, persistence detection, and enterprise hardening strategies? Subscribe to the LinuxSecurity newsletter for weeklythreat analysis, infrastructure security insights, and practical guidance covering the Linux and open-source ecosystem. Related Reading Egress Filtering Primer for Monitoring Outbound Traffic Linux Server Monitoring Essential for Modern Security Operations Linux Attackers Abuse Admin Tools For Stealthy Intrusions Strengthening Linux SSH Configurations to Prevent Proxy Attacks Understanding Linux Persistence Mechanisms and Detection Tools . Learn how to identify and investigate suspicious outbound connections on Linux servers to enhance your security posture.. Linux Outbound Traffic Analysis, Network Security Monitoring, Malicious Connection Detection, Process Behavior on Linux. . MaK Ulac
 May 27, 2026
•
May 27, 2026
• How to Secure My Network
167
 security advisoryintrusion detectionnetwork monitoring
How to Install and Set Up Snort IDS on Linux (Working Alerts in 30 Minutes)
Outcome Checklist This guide installs Snort as a passive intrusion detection system on Linux and verifies functionality by generating a test alert. Each step builds on the previous one. Do not skip steps. By the end of this guide: Snort is installed, and the version confirmed. HOME_NET is correctly configured. A local rule is created. Configuration validates without errors. A real test alert appears in /var/log/snort/alert Snort runs persistently via systemd (optional).. Identify Your OS and Network Interface Snort installation and packet capture depend on the correct operating system packages and the correct network interface. Identify both before proceeding. 0.1 Confirm Your Linux Distribution Run: cat /etc/os-release Review the values for: ID= ID_LIKE= If the system is Ubuntu or Debian-based, follow the Debian-based installation section. If the system is RHEL, Rocky, AlmaLinux, or similar, follow the RHEL-based installation section. 0.2 Identify the Active Network Interface List interfaces: ip -br link Display the routing table: ip route Identify the interface associated with the default route. Example: default via 192.168.1.1 dev eth0 In this case, eth0 is the interface that must be used with Snort. If the wrong interface is specified during execution, Snort will not capture relevant traffic. 0.3 Baseline System Note Snort depends on a stable and properly maintained Linux host. Confirm the system is updated and hardened before installation using a standard verification process, such as this guide on verifying Linux server security . Step 1: Install Snort On Linux, package installs are predictable when repositories are correctly configured and the system is current. If dependencies fail or the binary does not register, the issue is usually repository state rather than Snort itself. Install using your distribution’s native package manager. Ubuntu / Debian Refresh package metadata: sudo apt-get update Install Snort and default rule packages: sudo apt-get install -y snort snort-common snort-rules-default During installation, you may be prompted for network configuration values. These can be adjusted later in snort.conf . Confirm the binary is present and executable: snort -V which snort snort -V must return version information. which snort must return the binary path, typically /usr/sbin/snort . If the version does not print, resolve package errors before continuing. RHEL / Rocky / AlmaLinux Update repositories: sudo dnf -y update Install Snort: sudo dnf -y install snort Verify the installation: snort -V which snort snort -V must return version information. which snort must return the binary path. If the version does not print, resolve repository or package issues before proceeding. Some RHEL-based repositories install the Snort engine without bundled rule sets. This guide uses a manually created local.rules file, so additional rule downloads are not required for validation. For source-based installations or advanced deployment scenarios, refer to the official Snort installation documentation at the Snort installation guide . Step 2: Verify Snort Version (Snort 2 vs 3 Awareness) At this point, the package should be installed and the binary available in your path. Confirm the engine starts and reports a version. snort -V The command must return version information and exit cleanly. That confirms the binary executes and the required libraries are present. This guide is written for standard Snort 2.9.x package installations that use snort.conf . There is no version comparison here. You only need to confirm that Snort runs without error. If the command fails, resolve that before touching configuration files. Step 3: Confirm Important Snort Paths Linux packages do not always place files in identical locations across distributions. Before editing anything, confirm where yoursystem installed Snort components. Run: whereis snort Review the output carefully. From this, identify: Snort binary path Typically /usr/sbin/snort . This is the executable used in manual runs and systemd . Configuration file location ( snort.conf ) Often under /etc/snort/ . This is the primary configuration file you will edit. Rules directory Commonly /etc/snort/rules/ . This is where local.rules will reside. Log directory Frequently /var/log/snort/ . This is where alert output will be written. Do not assume default paths. Confirm them on your system before proceeding to configuration changes. Step 4: Prepare Required Directories and Permissions Snort writes logs, tracks state, and loads local rules from specific directories. Package installs usually create these, but verify them explicitly on your system. Create required directories if they do not exist: sudo mkdir -p /etc/snort/rules sudo mkdir -p /var/log/snort sudo mkdir -p /var/lib/snort Create a dedicated service account if it is missing: id snort 2> /dev/null || sudo useradd -r -s /usr/sbin/nologin -d /var/lib/snort snort Set ownership and restrict access: sudo chown -R snort:snort /var/log/snort /var/lib/snort sudo chmod 750 /var/log/snort /var/lib/snort Create the local rules file: sudo touch /etc/snort/rules/local.rules sudo chmod 640 /etc/snort/rules/local.rules Snort must have write access to its log directory or alerts will not be generated. Running the process as a dedicated service user prevents permanent root execution and limits system exposure. Confirm ownership before continuing. Step 5: Configure snort.conf Snort operates here as a passive intrusion detection system and requires minimal configuration changes to begin monitoring traffic. Locate the configuration file: sudo find /etc -maxdepth 4 -iname "snort.conf" Edit the file: sudo nano /etc/snort/snort.conf Ensure these linesare present and correctly defined: ipvar HOME_NET 192.168.1.0/24 ipvar EXTERNAL_NET any var RULE_PATH /etc/snort/rules include $RULE_PATH/local.rules HOME_NET must match your actual subnet. Replace 192.168.1.0/24 with your network range if different. If this system has a single public IP address, define HOME_NET using that IP with a /32 mask. Do not modify preprocessors. Do not enable inline mode. Step 6: Add a Local Test Rule At this stage Snort is installed and configured, but it has no custom logic tied to your environment. Add a controlled rule to confirm detection works. Edit the local rules file: sudo nano /etc/snort/rules/local.rules Add the following line: alert icmp any any -> $HOME_NET any (msg:"SNORT TEST - ICMP ping detected"; itype:8; sid:1000001; rev:1;) This rule generates an alert when an ICMP echo request enters HOME_NET. It is intentionally simple and designed for validation, not production monitoring. The sid value must be unique within your rule set. Do not reuse existing IDs. Rule structure, keywords, and deeper detection logic are covered separately in this guide on network intrusion detection using Snort . Save the file before moving to validation. Step 7: Validate Configuration (Mandatory) Before running Snort live, test the configuration. This prevents runtime failures caused by syntax errors or missing includes. Run: sudo snort -T -c /etc/snort/snort.conf -i INTERFACE Replace INTERFACE with your active network interface identified earlier. This command performs a configuration test only. It does not start packet inspection. If successful, you will see a message indicating configuration validation completed. Common validation failures: Incorrect RULE_PATH Missing include $RULE_PATH/local.rules HOME_NET does not match your subnet Permission errors on rule or log directories Resolve any errors before proceeding. Snort should exit cleanly with no fatal messages. Step 8: RunSnort and Generate a Real Alert Start Snort in console mode with fast alert output: sudo snort -A fast -q -c /etc/snort/snort.conf -i INTERFACE -l /var/log/snort Replace INTERFACE with your active NIC. From another host on the network, send ICMP traffic to the Snort sensor: ping -c 3 TARGET_IP Replace TARGET_IP with the IP address of the Snort system. In a separate terminal, verify log output: sudo ls -la /var/log/snort sudo tail -n 20 /var/log/snort/alert You should see an entry containing SNORT TEST - ICMP ping detected. If no alert appears, check the following: Wrong interface specified during startup HOME_NET does not match the monitored subnet local.rules not properly included in snort.conf Once the /var/log/snort/alert file exists and contains entries, alert forwarding to syslog or external dashboards can be configured separately as described in this guide on real-time alerting with Snort . Note : If testing in a cloud environment, ensure ICMP is allowed in the provider firewall or security group. Step 9: Install systemd Service for Persistence Manual execution confirms detection works. Production systems require the service to start at boot and restart automatically if it fails. Create the systemd unit file: sudo tee /etc/systemd/system/snort.service > /dev/null /dev/null || true endscript } This configuration: Rotates logs daily Retains seven days of history Compresses older logs Preserves correct ownership and permissions Reloads the Snort service after rotation Verify logrotate configuration: sudo logrotate -d /etc/logrotate.d/snort The -d flag performs a dry run and reports potential issues without modifying files. Log management should be validated periodically, especially on high-traffic sensors. Silent disk exhaustion is avoidable. Frequently Asked Questions Does this guide enable inline blocking? No. This setup runs Snort strictly as a passive intrusiondetection sensor. Inline blocking and prevention use cases are covered separately in this overview of network intrusion prevention systems . What should I do after alerts start appearing? Installation only confirms detection works. Alert triage, escalation paths, and response handling are operational decisions covered in this guide on intrusion detection response . How do I measure Snort performance? Throughput testing, packet loss analysis, and tuning methodology are separate from installation and discussed in this analysis of intrusion detection systems by the numbers . Is signature-based detection still enough? Static rule matching works, but modern detection strategies often extend beyond traditional signatures. This guide outlines broader approaches to modernizing your intrusion detection strategy . . Identify Your OS and Network Interface Snort installation and packet capture depend on the correct o. outcome, checklist, guide, installs, snort, passive, intrusion, detection, system, linux. . MaK Ulac
Feb 17, 2026
•
How to Secure My Network

167
 network monitoringtroubleshootingcommand line tool
20 Essential Netstat Commands for Effective Linux Network Management
Learn 20 useful netstat commands for network monitoring and troubleshooting in this Tecmint tutorial. . netstat (network statistics) is a command line tool for monitoring network connections both incoming and outgoing as well as viewing routing tables, interface statistics etc. netstat is available on all Unix-like Operating Systems and also available on Windows OS as well. It is very useful in terms of network troubleshooting and performance measurement. netstat is one of the most basic network service debugging tools, telling you what ports are open and whether any programs are listening on ports. . Uncover powerful ifconfig commands to configure and monitor network interfaces on UNIX systems.. Netstat Commands, Linux Network Management, Network Troubleshooting. . Brittany Day
Jun 30, 2021
•
How to Secure My Network
167
 tcpdumpnetwork monitoringpacket analysis
Using Tcpdump for Effective Network Monitoring and Troubleshooting
Get started using tcpdump for network troubleshooting and monitoring with this comprehensive cheat sheet, which demonstrates different types of packet capture scenarios using actual tcpdump examples. . When it comes to network troubleshooting and monitoring, what types of tools you are using make a world of difference. While required tools may vary depending on the types of network problems you are dealing with, there are a set of essential tools that every network administrator must be familiar with, and tcpdump is definitely one of them. tcpdump is a command-line tool packet sniffing that allows you to capture network packets based on packet filtering rules, interpret captured packet content, and display the result in a human-readable format. The main power of tcpdump comes from its (1) flexible packet filtering rules and (2) versatile protocol dissection capability . Although GUI-based Wireshark provides equally powerful filtering/dissecting capabilities via a more user-friendly interface, its relatively high memory footprint (for buffering packets) and GUI-based operations make Wireshark unsuitable when you are troubleshooting directly from remote headless servers. . Become proficient in network diagnostics through practical tcpdump illustrations for efficient packet analysis and oversight activities.. Tcpdump Examples, Network Tools, Packet Capture, Monitoring Guide. . Brittany Day
Apr 07, 2021
•
How to Secure My Network
167
 network monitoringsecurity managementsystem tools
How To Monitor Network Activity For Troubleshooting And Security
Whether you are troubleshooting a network issue or verifying the security of your network, monitoring network activity is crucial to maintaining a secure Linux system. Learn about multiple great methods for monitoring network activity on a Linux system in this LinuxConfig tutorial. . There are many reasons why you may want to monitor the network activity on your Linux system. You may be troubleshooting a network issue, you may want to check to make sure that there are no malicious applications creating suspicious network activity, or you may simply want to know if any processes are phoning home. Whatever the reason, here are a few methods to see which processes on your system are engaged in network activity and who they are communicating with. In this tutorial you will learn : How to monitor network connections and listening services with netstat How to monitor network connections and listening services with lsof How to monitor network connections and listening services with ifconfig What tools you can use to examine the data being sent over the network . Discover practical techniques to oversee network operations on your Linux machine, aiding in diagnostics and security assessments.. Linux Network Monitoring, Security Management, Process Monitoring. . Brittany Day
Nov 27, 2020
•
How to Secure My Network
167
 network monitoringopen sourcesystem administration
Nagios Monitoring Configuration Guide for System Administrators
Learning Nagios 3.0 is a comprehensive configuration guide to monitor and maintain your network and systems. It is a practical guide to setting up the Nagios 3.0 open source network monitoring tool, installing and configuring Nagios 3 on various operating systems. It will help understand system monitoring and how Nagios works. Nagios 3 is a system that watches to see whether hosts and services are working properly, and notifies users when problems occur. Nagios allows both the monitoring of services on its own, and the receipt of information about computer and service statuses from other applications. Nagios constantly checks other machines on your network and various services on those machines. It is a modular and flexible solution that uses plug-ins to do its job.. This is a beginner-level book, which will introduce the Nagios tool for system and network monitoring to System Administrators who are interested in monitoring their systems. Knowledge of Linux System administration is expected. It will teach readers to secure their systems in a much improved manner. The focus is on teaching system administrators to secure their systems in a much improved manner incorporating the newer features of Nagios Version 3. It will teach beginners the basics of installation and configuration of Nagios version 3; it will show professionals who have already worked on earlier versions of Nagios the new features of Nagios like inheritance and the new internal functions like better check scheduling. The main purpose of system monitoring is to detect and report any system not working properly as soon as possible, so that you are aware of problems before users run into them. You can read more about the book here; https://subscription.packtpub.com/search Tags : nagios, nagios 3, netsaint, network monitoring, system monitoring, unix, linux, ubuntu, alerts, plugins, open source, perl You can read more about the book here: https://subscription.packtpub.com/search . This is a beginner-level book, which will introduce theNagios tool for system and network monitorin. learning, nagios, comprehensive, configuration, guide, monitor, maintain, network. . LinuxSecurity Contributors
Apr 16, 2009
•
How to Secure My Network
167
network monitoringinstallation guideopen source toolZabbix Setup: Network Monitoring and Event Tracking Guide
There are so many network monitoring options for the Open Source user, one might get sick of them. But not likely! Zabbix has the capability to monitor just a about any event on your network from network traffic to how many papers are left in your printer. It produces really cool graphs. In this HowTo we install software that has an agent and a server side. The goal is to end up with a setup that has a nice web interface that you can show off to your boss. It's a great open source tool that lets you know what's out there. . The link for this article located at is no longer available. . The link for this article located at is no longer available.. there, network, monitoring, options, source, might. . LinuxSecurity Contributors
Nov 27, 2007
•
How to Secure My Network
160
intrusion detectionnetwork monitoringUbuntuSetting Up Snort IDS with MySQL Integration on Ubuntu 7.10
Ubuntu Gutsy-Gibbon on the brain? Looking to set up a solid defense with Intrusion Detection Snort, MySQL and more? HowToForge has a great guide from a contributor, Devilman: In this tutorial I will describe how to install and configure Snort (an intrusion detection system (IDS)) from source, BASE (Basic Analysis and Security Engine), MySQL, and Apache2 on Ubuntu 7.10 (Gutsy Gibbon). Snort will assist you in monitoring your network and alert you about possible threats. Snort will output its log files to a MySQL database which BASE will use to display a graphical interface in a web browser. Read on... . The link for this article located at HowToForge.com is no longer available. . The link for this article located at HowToForge.com is no longer available.. ubuntu, gutsy-gibbon, brain, looking, solid, defense, intrusion, detection, snort. . LinuxSecurity Contributors
Nov 20, 2007
•
How to Harden My Filesystem

Get the latest News and Insights
Get the latest Linux and open source security news straight to your inbox.
Community Poll
Should Linux servers automatically install security updates?
Search Topics
Powered By

Linux Security - Your source for Top Linux News, Advisories, HOWTOs and Feature Releases
QUICK LINKS
subscribe to newsletters!
Like staying secure? So do we.
Sign up for updates, tips, and alerts!