Explore top 10 tips to secure your open-source projects now. Read More
×Maximize IT Efficiency With Open-Source Monitoring Solutions
5 - 10 min read

Understanding how an IT environment is performing is vital for telemetry data. By gathering this information and monitoring it closely, administrators can identify issues and potential problems before they cause significant disruptions.
The most critical method for identifying performance and network security issues is monitoring. This helps ensure that things are running efficiently and identifies potential network security threats, such as cryptominers consuming all the CPU resources or a Denial-of-Service attack.
Several open-source network security toolkits are available for collecting and monitoring telemetry data. These tools can gather data from various sources, including server logs, application performance monitors, and network traffic monitors. Data can be analyzed to find cyber security trends and patterns, which can then be used to improve security posture and performance in an IT environment.
Let’s look at a guide to open-source monitoring tools, where we’ll introduce you to the monitoring world and show you how to get started with popular network security toolkits.
What Are The Benefits of Open-Source Monitoring?
 Open-source monitoring provides many benefits for users. Organizations can save money and time while getting the required features and functionality. In addition, open-source monitoring tools are often more flexible and customizable than their commercial counterparts, making them better suited to meet an organization's specific needs.
These tools are usually free, saving organizations a considerable amount of money, mainly if they already use other open-source software from application security trends. Additionally, many open-source tools come with features and plugins that can customize the application further to meet an organization’s specific needs. Open-source monitoring solutions tend to be more flexible than commercial options, giving organizations more control over monitoring and a better understanding of how it works. You can use it to your advantage.
Time-series data is information collected regularly, tracking when the intel was collected depending on the tool used and the intervals set by the server. Time-series data allows users to analyze data security trends in user behavior or find correlations in the network logs that can help in multiple ways. Most of the tools mentioned below use time-series data to help users better understand what is going on in the network.
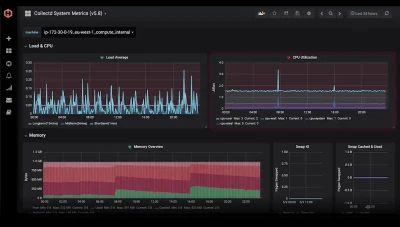
Grafana
Grafana is an open-source data visualization tool that can monitor various data sources. It is a popular tool for developers and DevOps professionals, as it can create custom dashboards and alerts and has a wide range of plugins that allow you to extend its functionality.
InfluxDB, Prometheus, and ElasticSearch permit you to access Grafana across various platforms, as dashboards monitor everything from CPU usage to network traffic. Grafana can be deployed on the cloud or premises where users do not need to have their data streamed over the cloud.
Graphana’s dashboard offers various visualization selections, including geo maps, heat maps, and histograms. The dashboard also contains different individual panels with varying functionalities that can be used to query, visualize, set up alerts, and easily understand the data presented with the help of metrics. Once alerts are set up, Grafana can send alerts through Slack or any other communication platform preferred.
Moreover, Grafana has built-in support for Graphite (which we will discuss later), and utilizing both network security toolkits together allows users to get customized data results by adding expressions such as add, filter, avg, max, min, and so on.

Prometheus
With Prometheus, you can collect metrics from your system applications and then visualize and query that data to help you troubleshoot network security issues.
Prometheus is an excellent option for open-source monitoring because it is easy to set up and use, has many integrations with other tools and services, and offers various forks and derivatives for personalizing your platform.
To start with Prometheus, you must install the software on your servers. Then, start collecting metrics from your systems and applications. Finally, use the PromQL query language to query your data and generate graphs and dashboards.
The main Prometheus features include multidimensional data modeling using time-series data and PromQL, a flexible source for leveraging multifaceted data. Moreover, it does not rely on distributed storage, uses a pull model (meaning it actively “pulls” data over http), pushes time-series data, monitors target discovery, and has multiple visualization options to select. Once alert conditions are established, Prometheus can send notifications through email, Slack, or other external systems.
Prometheus monitoring includes service and host metrics, website uptime and status, and cron jobs. This permits the server to scrape data from HTTP servers with published files on HTTP endpoints that run 24/7. Monitoring the operating system can help to gain information on hard disk storage and website status checking through black box exporters. Configuring the Prometheus.yml file to the specific endpoint on a target URL allows the user to receive information on response time. Prometheus is also used to monitor cron jobs and see if they run at specified intervals. It can push the last successful job and compare current times to it, generating an alert if the time exceeds the defined threshold.
Like Grafana and Graphite, Prometheus and Grafana can combine for a great data visualization setup. Grafana has preferred visualization dashboard features, while Prometheus’s back end proves strong. Therefore, once queries are run from the Grafana dashboard, it fetches data from Prometheus.

Graphite
Graphite is a popular open-source monitoring tool that can track application security trends and infrastructure performance. It is easy to set up and provides many features and plugins to make it even more powerful. Graphite is highly scalable and can be easily integrated with other tools and systems to track the performance of your applications and infrastructure, making it a valuable addition to your network security toolkit.
Graphite metrics are straightforward using scripts, applications, or command lines. Pushing metrics with the command line is simple and requires three values: a metric name, a numeric value, and an epoch timestamp. The resulting command will look like “echo “ex.bar 41 `date +%s`” | nc graphite-server. 2003,” where 2003 is the selected port.
Graphite is also excellent for automatically refreshing after every action, meaning feedback is instantaneous. Moreover, it is a great tool to use when more than just one person monitors data. Graphite URLs can be copied and shared, and if the URL is altered through additions and graph changes, the new URL can be sent with the updates.
However, the most convincing aspect of Graphite is the extensive library available for statistical and transformative functions. As of the latest version, there are more than 100 available functions.
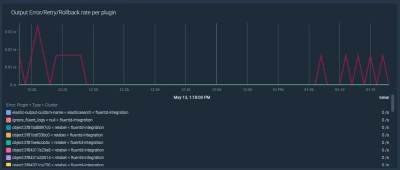
Fluentd
Fluentd is an open-source data collector for the unified logging layer. It was initially developed by Treasure Data, Inc. (now Fluree PBC) and is now a Cloud Native Computing Foundation (CNCF) project. Fluentd enables you to integrate data gathering and consumption to improve security posture through data utilization and comprehension.
Using a simple configuration file, this network security toolkit specifies input and output sources and sinks. Inputs can be files, system logs, HTTP endpoints, etc. Outputs can be files, databases, or message queues. Fluentd also has plugins for various data sources and outputs that the Fluentd community maintains.
Fluentd joins all aspects of processing log data to collect, filter, buffer, and output logs across multiple sources and destinations. Moreover, it has 500+ plugins from the community’s contributions, allowing more customization and better logging use. Fluentd utilizes minimal resources and has built-in reliability, supporting memory and file-based buffering to prevent inter-node data loss.
ELK
If you're looking for a powerful and open-source monitoring solution, look no further than ELK. It comprises of three main components:
- ElasticSearch is a flexible and powerful search engine that indexes and searches for data from any source.
- Logstash is a data processing pipeline to collect, parse, and filter data.
- Kibana is a visualization tool that can create dashboards and visualizations to help you make sense of your data.
ELK is an excellent choice for open-source monitoring solutions because it is flexible and scalable. It can monitor anything from small-scale to broadly distributed systems and is also simple to set up and use.
ELK offers a variety of visualization options that include area charts, heat maps, horizontal bar charts, line charts, pie charts, and vertical bar charts. ELK also has data options such as tables, gauges, goals, metrics, coordinate and region maps, timelion and visual builder series, and more. These options allow users to choose what data is shown and how, a helpful tool in understanding what the logs contain.

SigNoz
SigNoz is an open-source application monitoring tool that provides observability for developers. Uniquely designed to run smoothly on Kubernetes, SigNoz is the go-to tool for infrastructure running on the platform.
What makes SignNoz unique?
- User-friendly UI for easy navigation and use.
- In-depth application metrics and ability to trace issues to the individual line of code.
- Smooth Kubernetes operation, perfect for any platform running Kubernetes.
Logstash
Logstash is a server-side data processing pipeline. Its unique strength lies in its robustness and versatility, capable of ingesting from various data sources and shipping it to a preferred 'stash' like Elasticsearch.
What makes Logstash unique?
- It supports diverse data types and has a rich input, filter, and output plugin selection.
- Simplifies the distribution and collection process of the data.
- The super-easy setup process is ideal for real-time insights.
Graylog
Graylog is a centralized log management solution that stands out for its ability to handle vast amounts of machine data.
What makes Graylog unique?
- High-capacity log data management that is perfect for handling terabytes of machine data.
- Easy-to-use web interface for smooth user experience.
- Correlation of all log data in real-time for rapid responses to incidents.
Syslog-ng
Syslog-ng is a flexible logging system. Known for its scalability, Syslog-ng is powerful and can process millions of logs per second.
What makes Syslog-ng unique?
- Flexible and adaptable to different logging needs.
- It has an enterprise-level speed, which makes it ideal for managing logs from a vast network infrastructure.
- Ability to collect, process, filter, and store log data.
Logwatch
Logwatch is a customizable log analysis tool. With its ability to simplify scanning through multiple logs, users can focus more on the crucial changes that might indicate potential security breaches.
What makes Logwatch unique?
- There is an abundance of customization options, perfect for various needs.
- Simplifies scanning of logs for more focus on essential changes.
- Ability to send precise analysis reports.
Apache Flume
Apache Flume is a robust service designed for efficiently collecting, aggregating, and moving large amounts of log data. Its fault-tolerant nature makes it perfect for managing large-scale, real-time data streams.
What makes Apache Flume unique?
- Its fault-tolerant nature and linear scalability make it best for large-scale data.
- Supports streaming data flows, ideal for real-time analysis.
- Customizable implementations according to user needs.
How To Choose the Right Open-Source Monitoring Tool for Your Needs
Consider a few things before choosing if you're looking for an open-source monitoring tool. There are four main types of monitoring you can choose from are as follows:
- System Performance tracks system resources like CPU and memory usage.
- Application Performance looks at how well your applications are running. This can include response time, error rates, and throughput.
- Network Performance checks network resources like bandwidth and latency.
- Security identifies network security threats and cyber security vulnerabilities.
Final Thoughts on Open-Source Log Analytics & Monitoring
While there are challenges concerning the functionality of these open-source tools, the benefits far outweigh these setbacks. Open-source monitoring provides a cost-effective way to start monitoring today and achieve better visibility into your system's performance. These network security toolkits can be a perfect starting point for monitoring. Get started today.


Powered By

Linux Security - Your source for Top Linux News, Advisories, HOWTOs and Feature Releases
QUICK LINKS
subscribe to newsletters!
Like staying secure? So do we.
Sign up for updates, tips, and alerts!