Audit Linux privileges now to limit compromise, escalation, and system-wide damage. Review Linux Privileges×
Top Open Source Network Monitoring Tools For IT Infrastructure Management
4 - 8 min read

It's necessary to monitor your company's network for several reasons. Modern networks can be monitored in a variety of ways. In contrast to application performance management systems, which use agents to retrieve performance information from the application stack, network monitoring tools are specifically made for the purpose of monitoring network traffic and response times.
Regardless of the sector you operate in, you must install some sort of network monitoring if your company relies on a network to function. Linux network monitoring solutions are a priceless resource that gives you the visibility you need to maintain your system's operation. The performance of individual nodes and apps can be monitored using Linux network monitoring solutions.
This article provides an overview of Linux network monitoring solutions that can be deployed.
Why Are Network Monitoring Tools Important?
Linux network monitoring solutions are essential for maintaining networks since they let you monitor all connected devices from a single location. By identifying devices with poor performance, these tools make it easier for you to intervene and troubleshoot the problem at the source.
Executing thorough troubleshooting can reduce performance issues and guard against security vulnerabilities. Another benefit of routine network maintenance is preventing disruptions that could send thousands of customers offline.
Using a network monitoring tool, you can:
- Auto-discover connected devices
- View real-time and past performance data for devices and apps.
- Set up alerts to notify unusual activities.
- Analyze network activity through graphs and reports
Benefits Of Open Source Monitoring
Open-source server monitoring comes with features that keep track of logs and monitor shared server data to improve security. Users of these programs can email service request responses and crash reports. These open-source monitors can also scan the entire server, checking each line of code and piece of data for flaws and making recommendations for how to solve them. Some other benefits include the following:
- Cost-effective: Most open-source software can be used free of cost. A small expense may be incurred when third-party products, such as plug-ins, are used. However, open-source software is free for anybody to download and use any way they see fit.
- Flexible: Open-source software is designed with the premise that it can and will be upgraded as users discover bugs and areas for development. Users can patch a bug and upload the program's revised version if they discover a bug. You can continue utilizing the same tools you have been using with open source and add new features as required.
- Secure: Because open-source code is publicly available and editable, anyone can review it and fix errors. Thus, open-source software has the potential to be highly secure.
Top 5 Open Source Network Monitoring Tools
Open-source Linux network monitoring solutions that suit your needs are usually influenced by several elements, such as auto-discovery, data mapping, event logging, alarm systems, reporting, and server request management. However, to make your experience better, here is a guide to open source monitoring tools that are considered to be industry leaders by experts.
Cacti
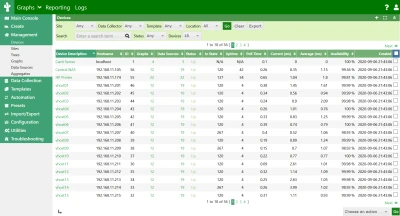 Cacti is a graphing tool that works as an add-on to RRDTool and is used by many network managers to gather performance information in LANs. To build graphs of traffic data, Cacti supports the Simple Network Management Protocol (SNMP) on Windows and Linux.
Data used by Cacti typically comes from user-written programs that ping hosts on a network. Graphs are created using the values that the scripts produced, which are stored in a MySQL database. Depending on the needs, Cacti can additionally customize the servers and dashboard.
Cacti also allows users to set a timer for polling and will automatically generate graphs from the gathered data of each poll. Another one of its capabilities is that as a device monitoring tool it can automatically scan for and add new devices once they are found. One of Cacti’s available plugins is called Spine and it allows for faster polling, which can especially be helpful for users monitoring larger networks. Cacti also supports users, user groups, and domains, allowing administrators to set different permissions based on only what they need and therefore not risking or compromising the network. Moreover, Cacti is a customizable tool that offers a variety of themes, skins, and languages, as well as around 12 plugins.
You can download Cacti here.
Nagios
 As an open-source monitoring system, Nagios provides various features, including the ability to integrate external applications by utilizing an additional plugin. Applications, websites, middleware, and web servers are just a few of the many settings that it can monitor.
Additionally, this application includes a problem-response technique that allows you to address website issues and expedite work. With Windows monitoring built in, this tool enables users to manage statistics and retrieve information from the website.
A huge volume of requests can be readily handled by Linux monitoring with Linux servers. The application monitoring capability aids in managing traffic coming from the application and extracting data from it. It also has a quick page-fixing detection technology.
Nagios uses server-client architecture and operates with MSSQL for data. It can monitor and generate graphs on operating system metrics, services, state as well as a variety of different protocols including SMTP, POP3, HTTPS, and more. Furthermore, Nagios supports around 50 plug-ins, allowing users to do much more when it comes to network monitoring.
You can download Nagios here.
Sensu
 There are two versions of Sensu: the basic version and the Sensu Go version, which is designed to meet the needs of diverse users. Thanks to its outstanding features for custom script implementation, this application offers efficient health monitoring tactics. It combines plugins and gathers metrics data to produce thorough reports.
It offers several integrated capabilities, like Splunk, ElasticSearch, ServiceNow, and many others, that make working more convenient. The process of agent identification is automated and has cutting-edge features like an Active directory.
With the help of CRL support, this tool has external PKI verification. Using a productive enterprise data store, it improves working and scalability.
Sensu uses transport architecture and uses MSSQL. If using the regular Sensu tool, network monitoring will be in code, however, Sensu Go displays data in different ways including graphs and trees. This tool can monitor servers, services, and applications, and supports more than 50 plug-ins.
You can download Sensu here.
Zabbix
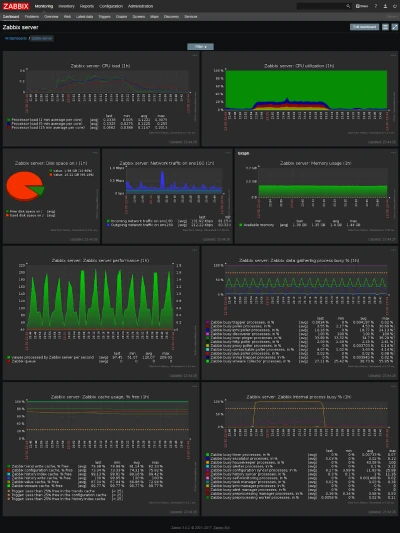 Due to its adaptable network monitoring capabilities, firms like Dell and Salesforce employ Zabbix. You can identify issues that need to be fixed by tracking network statistics, such as network bandwidth utilization, network health and configuration changes.
Zabbix connects performance data via SNMP, IPv6, and the Intelligent Platform Management Interface (IPMI). It also allows you to automatically detect devices connected to your network before utilizing an out-of-the-box template to start network monitoring.
Like Nagios, the architecture of Zabbix is server-client architecture. It operates with different versions of SQL which are MySQL, PostgreSQL, and SQLite. It can monitor both devices and servers, and generates data on free disk space, CPU load, network traffic statistics, memory consumption, application status, and much more. A great feature of Zabbix is that users can set up actions on remote machines, which are triggered automatically upon the occurrence of predefined events. Zabbix supports 14 plug-ins.
You can download Zabbix here.
Prometheus
Prometheus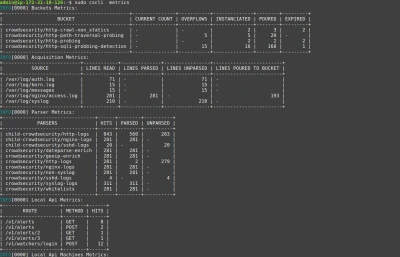 is a popular open-source network monitoring tool with a sizable community. It was created especially for time-series data monitoring. Time-series data can be recognized using key-value pairs or metric names.
Every time an event is raised, Prometheus' Alertmanager gives you the option to examine notifications. If necessary, you can quiet notifications sent by Alertmanager via email, PagerDuty, or OpsGenie.
Excellent visual elements in Prometheus let you choose among the browser, the template language, and the connection with Grafana. To personalize your Prometheus experience, you can incorporate numerous external data sources like StatsD, JMX, and Docker.
Each Prometheus server is standalone, meaning they do not rely on remote servers or network storage. It uses PromQL for data, and multiple client libraries to match language used for users’ applications. The official Prometheus libraries include Go, Java or Scala, Python, Ruby, and Rust but there are also many more unofficial third-party libraries such as Bash, C, C++, and more. Prometheus supports 10 official plugins, and such as the client libraries, there are many more unofficial ones that can also be used.
You can download Prometheus here.
Final Thoughts
The market for open-source Linux network monitoring solutions has been steadily expanding, which has paved the way for competition and encouraged developers to create even more effective software. The market for network monitoring is expected to increase from $27.6 billion in 2020 to $50 billion in 2027. While proprietary software may have limitations, open-source alternatives are affordable, powerful, and adaptable business tools. You can maintain your IT network while saving money and enjoying peace of mind by using open-source Linux network monitoring solutions.


Powered By

Linux Security - Your source for Top Linux News, Advisories, HOWTOs and Feature Releases
QUICK LINKS
subscribe to newsletters!
Like staying secure? So do we.
Sign up for updates, tips, and alerts!