Explore top 10 tips to secure your open-source projects now. Read More
×


Stay Ahead With Linux Security Features

 identity management security tactics
 For years, we secured our Linux infrastructure by building walls: VPCs, security groups, and hardened SSH configurations. We treated the cloud like a virtual data center, assuming that if we kept the "bad guys" out of the network, our workloads were safe. . That model is no longer sufficient. Today, one of the most common paths from an initial compromise to a major cloud breach is the identity assigned to your Linux workload. When an attacker gains code execution on a Linux instance—through a...
 Jul 17, 2026
 security practices patch management
 Most of us don't hear about a kernel vulnerability until a CVE lands in our inbox or the vulnerability scanner starts complaining. By then, the patch isn't new anymore. Kernel developers may have been passing it around for review, arguing over the implementation, or revising it for days before anyone outside that community noticed it. None of those discussions are secret. They're sitting in mailing list archives, Git commits, and patch reviews where they've been the whole time. The strange...
Jul 14, 2026
 Linux security cyber attacks
 Every Linux server in your fleet produces thousands of events every minute. From journald logs and auditd records to kernel-level eBPF hooks, your systems are constantly talking. Most of that noise is just the mundane churn of system services, CI/CD runners, or routine administrative automation. But among that noise, an attacker might be establishing a foothold, moving laterally, or setting up persistence. The challenge for any security team is: how do you separate the routine from the...
Jul 13, 2026
 open-source infrastructure risk
 Security scanners flag exposed API keys in public repositories every day. The initial response is usually predictable: delete the commit, revoke the credential, and move on. That’s a mistake. . In a real Linux environment, an API key never stays in one place. By the time it hits a public repo, it’s already everywhere. It’s in the CI/CD pipeline. It’s in your container registry. It’s in the build logs. It’s in the backups. Git makes this worse because the history never dies. Deleting a file in...
Jul 11, 2026
 open-source rootkit
 Most of us think of Linux rootkits as ancient history—the stuff of 90s hacking forums and clunky malware that would crash your system if you looked at it the wrong way. But if you think they’ve gone away, you’re mistaken. They’ve just gotten smarter. . Modern attackers aren't using the noisy tools of the past. Today’s threats are surgical. Many of today’s most advanced Linux rootkits operate at the kernel level or abuse legitimate system features to blend in with normal traffic. They’re...
Jul 09, 2026
 Refine features
X Clear Filters
Get the latest News and Insights
Get the latest Linux and open source security news straight to your inbox.
Community Poll
Should Linux servers automatically install security updates?
Loading...
Explore Latest Linux Security features
We found 10 articles for you...
102
 network securitythreat detectionlinux monitoring
Network Security Monitoring: Common Linux Monitoring Gaps That Hide Threats
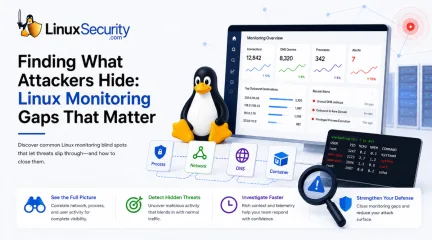
If you’re relying on standard network logs to protect your Linux infrastructure, you’re flying blind. Most organizations believe they have network security monitoring because they’re capturing traffic, but they’re actually just collecting noise. Real security—the kind that stops an attacker—happens in the gaps between the network, the process, and the host. When an attacker breaches a Linux server, they rarely reach for a custom zero-day. They use what’s already there: curl, bash, python, or netcat. Because these are standard tools, traditional monitoring platforms see the traffic as "authorized" and let it sail right through. To stop this, stop looking at logs in silos. You have to correlate the network flow with the specific host activity that triggered it. . What Is Network Security Monitoring? Network security monitoring is the continuous collection and analysis of network and host telemetry to identify malicious activity, investigate incidents, and detect attacks before they spread. There’s a massive difference between keeping a server running and actually monitoring its security. If you’re just watching performance metrics or bandwidth, you’re doing basic network monitoring. Security monitoring is a forensic exercise. During an investigation, nobody cares that a server connected to an IP address. The first thing you want to know is what made that connection. Was it SSH? Was it curl? Was it a Python process that shouldn't exist? If your monitoring can't answer those questions, you're working backward with half the evidence missing. Key Takeaway Network connection: Answers where traffic went. Host telemetry: Answers who generated it. Detection engineering: Explains whether it matters. Effective NSM: Requires all three. Outbound Traffic Without Process Attribution The biggest failure point is looking at an IP address without knowing the "who." If your network logs show a server reaching out to an unknown destination, but you can’ttell me exactly which process opened that socket, you’re investigating with incomplete evidence. Attackers love this ambiguity. They can run a malicious command that blends perfectly into the background of a busy server. To close this gap, map every socket to its parent process, the command-line arguments used, and the specific user account involved. Without that lineage, you're just staring at a list of numbers. DNS Activity Without Host Context DNS is a goldmine for attackers, which is exactly why they abuse it for C2 beaconing , data exfiltration, or DNS tunneling. Most teams treat DNS logs as garbage data—too voluminous to store or analyze. But if you don't know which host or container initiated that lookup, you’re blind. You need to tie DNS requests back to the source. If a database server is suddenly asking for a high-entropy domain that looks like a crypto-miner's C2, you need to know about it the second the query leaves the box. East-West Traffic Inside Linux Environments Traditional perimeter security is no longer sufficient for detecting internal attacker movement. Lateral movement happens via SSH, rsync, or database calls—traffic that never touches your edge firewall. Because this traffic is internal, it’s often ignored by security teams who assume that "inside" equals "safe." In reality, this is where attackers spend the most time, pivoting from a compromised web server to a back-end database. If you aren't monitoring internal flows, you’re giving them a free pass to traverse your environment. Encrypted Traffic That Looks Normal Containers make investigations harder because they don't stick around. A compromised pod can start, execute a command, establish a network connection, and disappear before anyone even notices an alert. If you're relying on logs collected after the fact, you're already behind. Runtime telemetry from tools like eBPF captures process execution and network activity while the container is still running, preserving the evidence you needbefore the workload disappears. That context is often the difference between understanding what happened and trying to investigate a workload that no longer exists Containers That Disappear Before You Investigate In a Kubernetes-heavy environment, containers are ephemeral—they spin up, do their work, and vanish. If an attacker gains execution, runs a malicious script, and the pod terminates, the evidence is often wiped from the host's standard logging. This is why traditional agent-based logging fails. You need runtime visibility, often utilizing eBPF , to capture the system calls and network activity in real-time. You need that metadata attached to the event before the container stops existing; otherwise, you're left trying to conduct forensics on a ghost. What Effective Linux Network Security Monitoring Looks Like During an investigation, context is everything. A network connection without a process isn't very useful, and a process without network activity doesn't tell the whole story either. You need both. That's why effective Linux network security monitoring relies on multiple sources of telemetry that complement each other instead of trying to make one tool do everything. Auditd: For recording system calls and process execution. eBPF: For deep, low-overhead kernel observability. Flow Logs: To map internal communication. DNS Logs: To catch C2 beaconing. Contextual Metadata: The glue that ties every network event to the specific workload. How Detection Engineering Improves Monitoring Detection engineering is how you move past the "out-of-the-box" alerts that generate nothing but noise. This is where modern NDR platforms become invaluable. They don't just alert on a connection; they correlate it, showing you the process lineage. They make it possible for an analyst to see that python was spawned by a web-server user, which then opened an outbound connection to a rare domain. However, effective detection engineering isn't a "set it and forget it" task. Itinvolves continuously tuning detections, eliminating false positives, incorporating new attacker techniques, and validating rules through purple-team exercises. The goal is to create alerts that analysts trust rather than ignore. Network traffic analysis is excellent at identifying communication patterns, but it becomes significantly more valuable when correlated with host telemetry that identifies the responsible process and user. Frequently Asked Questions What is Linux network monitoring? It's the practice of observing data flows, connections, and system-level actions within a Linux environment to detect unauthorized access. What’s the difference between NSM and NDR? NSM is the visibility layer (the "what is happening"), while NDR (Network Detection and Response) adds the correlation and automated response needed to stop threats. How does eBPF improve visibility? It lets you monitor the kernel and network with almost zero performance penalty—essential for high-density containers. What is detection engineering? It's the iterative process of building and refining security rules so they are specific to your environment, cutting out the noise. Is network traffic analysis enough to find attackers? Nope. Traffic analysis tells you where data is going, but host telemetry is required to identify who sent it and why . Conclusion At the end of the day, attackers aren't trying to outsmart your logs—they’re trying to hide in the gaps between them. The goal of your Linux network security monitoring shouldn't be to collect everything; it should be to create context. When you can tie a network flow to a specific user, process, and container, you take away the attacker’s ability to hide. That’s how you actually secure an environment. Want more Linux security news, vulnerability analysis, and software supply chain updates? Subscribe to the LinuxSecurity Newsletter and get the latest threats, advisories, and expert insights delivered directly to your inbox. . Linuxnetwork security monitoring identifies gaps that attackers exploit, enhancing protection and response. Learn more.. Linux Network Monitoring, Threat Detection Engineering, Security Telemetry, Process Attribution. . MaK Ulac
 Jun 30, 2026
•
Jun 30, 2026
•
102
 network securitythreat detectionSuricata
Monitoring East-West Traffic with Suricata: Finding Threats Inside Your Network
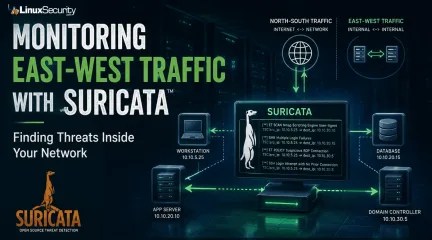
Most security teams are locked into a perimeter-first mindset. They obsess over north-south traffic—the data hitting the edge—while ignoring the reality of the modern data center. Once an attacker gets a foothold, they don't stay at the edge. They pivot. They move laterally. That's the east-west traffic problem: the internal chatter between servers, microservices, and databases that we treat as "trusted" simply because it’s inside the fence. . Using Suricata for east-west monitoring isn't about deploying another sensor. It’s about building a detection strategy that turns that internal silence into data. Note on Infrastructure: This guide assumes the use of a Linux-based sensor. Suricata’s ability to achieve high-throughput, real-time packet inspection relies on Linux-native kernel interfaces like AF_PACKET and eBPF . The tools used for analysis— jq , tcpdump , and ethtool —are standard utilities in the Linux ecosystem, making it the industry-standard OS for high-performance security monitoring. What Is East-West Traffic? In network security, we distinguish between two primary traffic flows: North-South: Traffic entering or leaving the network (ingress/egress). East-West: Traffic moving laterally between systems inside the environment. North-South Traffic East-West Traffic User browsing a website Web server communicating with a database Customer accessing an application Application server talking to another application Email arriving from the internet Domain Controller authenticating users Data leaving for a cloud service Administrator connecting to a server via SSH Most organizations already monitor north-south traffic extensively because it crosses the network perimeter. East-west traffic is different. Because it stays inside the wire, it is often blindly trusted. In reality, internal communications frequentlycontain the earliest indicators of a compromise. Why Attackers Care About Internal Traffic When an employee clicks a phishing link and installs malware, the attacker isn't finished—they are just getting started. Their objective is movement. They spend hours, or even days, identifying systems, discovering drives, enumerating user accounts, and testing remote access. This is lateral movement. Rather than attacking directly from the internet, the adversary pivots through your environment to reach a high-value target. This activity creates network noise: workstations scanning subnets, accounts accessing administrative shares, and unexpected SSH or RDP connections. If you aren't monitoring this, you are letting the attacker move freely through your "safe" zone. What Is Suricata? Suricata is an open-source engine designed to inspect network traffic in real time. It is far more than a basic packet capture tool; it acts as an IDS, an IPS, or a powerful NSM platform. Suricata understands application-layer protocols—like HTTP , TLS , DNS , SMB , and SSH . This allows you to identify suspicious behavior based on protocol patterns rather than relying on brittle IP and port matching. For internal monitoring, this application-layer visibility is your most powerful weapon. Why Use Suricata for East-West Monitoring? Internal networks are rarely as clean as we hope. They are full of accumulated complexity: legacy apps with undocumented connections, misconfigured services, and administrative tools that reach across segments. When you start inspecting this traffic with Suricata, you will discover behavior you didn't know existed. While not all of it is malicious, seeing it is the only way to establish a baseline. You need to know exactly which services are talking, the protocols they are using, and the patterns that define your stack. A Simple Real-World Example Consider a three-tier application: Web Server: Receives user requests. Application Server: Processesbusiness logic. Database Server: Stores application data. Under normal conditions, these paths are predictable. But if Suricata suddenly flags an employee workstation establishing SMB sessions directly to your database, you have an immediate red flag. It may be legitimate, or it may be an indicator of stolen credentials or unauthorized discovery. Without east-west visibility, that connection is invisible. Where Should You Deploy Suricata Sensors? You can’t mirror every port in the rack—that’s a recipe for packet loss and a mountain of useless logs. Strategic placement is the only way to scale. Protect the Crown Jewels: Focus sensors on segments housing Domain Controllers, sensitive databases, and management VLANs. Lateral movement dies when it hits a monitored high-value segment. Monitor Trust Boundaries: Place sensors at the chokepoints between internal segments . If your web tier is separate from your app tier, that is your first deployment point. Passive Over Inline: Start in Passive Mode using a TAP or a SPAN port. Don't go inline until you know what your "normal" looks like. Putting a blocking IDS in front of an internal application without a baseline is how you create your own outage. Build a Baseline Before Writing Rules A tool is only as good as the logic you feed it. Don't write rules until you see the data. Use jq on your Linux command line to parse your eve.json logs and identify the most frequent talkers. Find the most frequent internal talkers: Bash grep '"event_type":"flow"' eve.json | \ jq -s 'group_by(.src_ip, .dest_ip) | map({src: .[0].src_ip, dest: .[0].dest_ip, count: length}) | sort_by(.count) | reverse' | head -n 10 What Should You Detect? Focus your rule set on behavior, not signatures: Internal Recon: Alert on internal port scanning. An app server shouldn't be running an nmap scan against its neighbor. Credential Abuse: Look for SMB admin share access or unusual RPC calls. Protocol Abuse: Flag unauthorized SSH , RDP , or WinRM traffic between hosts that have no operational business communicating. Context is Everything If Suricata fires an alert, a log processor needs to tag it with asset criticality. An alert on a dev server is background noise; the same alert on a Domain Controller is an immediate incident. Workflow: From Detection to Investigation Suricata creates high-fidelity logs, but logs aren't answers. You need a workflow: Pipeline: Feed eve.json into a centralized logging stack. Noise Reduction: If your configuration management tool (e.g., Ansible ) hits every server on port 22 every 30 minutes, suppress those alerts early. Correlation: When an alert fires, pivot to your endpoint logs. Did that internal alert on Server A happen at the exact same time as a suspicious PowerShell execution? That's your correlation. Monitoring Encrypted Internal Traffic East-west traffic is increasingly encrypted. You don't need to decrypt every packet to gain visibility. Log TLS Metadata: Use Suricata to log the SNI (Server Name Indication) to see which domains are being requested. Fingerprinting: Use JA3/JA3S fingerprints to identify clients. A standard browser looks different than a custom Python lateral movement script. Identify Protocol Mismatches: Catch services running on the wrong ports: Bash grep '"proto":"SSH"' eve.json | grep -v '"dest_port":22' ## Performance Considerations Monitoring east-west traffic often means dealing with significantly higher volumes than the perimeter. Because Suricata is running on Linux, you have granular control to optimize performance: * **CPU Affinity:** Pin processing threads to specific physical CPU cores in suricata.yaml to prevent context switching from killing your throughput. * **Disable NIC Offloading:** Always disable LRO/GRO to ensure Suricata sees the full packets: ```bash sudo ethtool -K eth0 gro off lro off NUMA Locality: Ensure your NIC and the CPU cores running Suricata are on the same NUMA node to avoid memory access latency. Verify What the Sensor Sees Never assume the sensor is seeing the traffic. Use tcpdump to verify: Bash sudo tcpdump -i eth1 -n host 192.168.1.50 Final Thoughts Internal monitoring is a game of diminishing returns if you let the noise level get out of hand. Analysts will ignore your tools if they're constantly crying wolf. Suricata is a beast of an engine, but it doesn't run itself. By focusing on high-value segments and prioritizing visibility over blocking, you turn your internal network from a "safe zone" into a controlled environment where lateral movement is finally visible. . Explore how Suricata enhances east-west traffic monitoring for better internal network security against lateral attacks.. Suricata, threat detection, internal monitoring, east-west traffic, network security. . Anthony Pell
Jun 24, 2026
•

102
 threat detectionscalabilitylog management
How Open Source SIEM Architectures Scale Beyond Single-Server Deployments
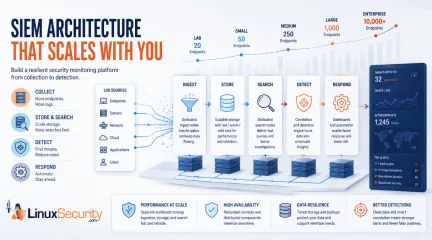
Building a SIEM is easier than scaling one. Most open-source deployments start as a simple "all-in-one" server. It is easy to set up, but that design rarely survives the transition from a lab to a production workload. . A SIEM watching 20 endpoints is not doing the same job as one watching 500. More endpoints mean more logs; more logs require more storage; more storage makes search heavier. Eventually, the very architecture that made your lab easy to deploy becomes the reason your production system fails. Production environments diverge from homelab setups because collection, storage, search, and analytics scale at different rates. Why Open Source SIEM Tools Struggle to Scale A typical first SIEM deployment runs everything on one virtual machine. This works for small environments because the workload is low. However, as the organization grows—adding authentication logs, firewall records, and cloud audit events—that architecture cracks. A Wazuh deployment monitoring 25 endpoints might generate thousands of events per hour, while a much larger deployment with 500 endpoints can process far more events in the same period. The architecture that worked on a single VM struggles with storage growth, indexing delays, and slow searches. SIEM Architecture Pattern #1: Scaling Log Management and Search Most hobby deployments run collection, indexing, storage, and search on the same server because it is simple. Mature environments eventually separate these workloads because each one scales differently. Dedicated ingest nodes receive and process incoming logs before they are indexed. Separating ingestion from storage and search prevents a spike in incoming data from slowing down your investigations or delaying your detections. If You Experience... Immediate Architectural Change Slow searches Move search workloads to separate, dedicated resources Storage filling quickly Implement hot/warm/cold storage tiers Delayed alerts Separate detection workloads from ingestion nodes Event backlogs Scale ingestion capacity horizontally SIEM Architecture Pattern #2: Design for High Availability and Failure Production SIEM architectures assume hardware failures, maintenance windows, and service outages will occur. The goal is not preventing failures; the goal is ensuring one failed component does not take the entire platform offline. Following the Wazuh architecture , environments typically move from a single manager to clustered deployments with redundant managers, distributed indexers, and load-balanced services. Failure Prioritization: Priority Component Reason 1 Storage/Indexing Historical data is often the hardest thing to recover 2 Manager/Controller Processes incoming events and runs detection logic 3 Collection Services Prevents data loss during network outages 4 Dashboard Useful for investigation, but not mission-critical SIEM Architecture Pattern #3: Building a Security Monitoring Pipeline Dashboards are only the view layer. Mature deployments treat the SIEM as a data pipeline. According to the Microsoft Sentinel architecture , data collection, analysis, retention, and automation are key parts of the pipeline. The biggest threat to this pattern is inconsistent data. If your logs aren't normalized—for example, if one source calls a field user and another calls it account_name—your detection rules will fail regardless of how powerful your infrastructure is. Decide: Pick five critical log sources. Verify that usernames, timestamps, hostnames, and source IPs are formatted consistently across all of them. Fix these "data-messy" spots before adding more dashboards. SIEM Architecture Pattern #4: Improving Threat Detection at Scale Morelogs do not automatically mean better security. Effective SIEM architecture best practices focus on what happens after data arrives: correlation and response. If you are building your first SIEM, prioritize detections that identify common attacker behavior rather than rare edge cases. Detection Why It Matters Failed logins followed by success Identifies potential password guessing New administrator account Identifies potential privilege escalation Login from a new system Identifies potential stolen credentials Security tool disabled Identifies potential attacker cleanup Decide: Build five reliable detective rules before adding five new log sources. A small number of working alerts is always more valuable than a massive pile of logs that no one is reviewing. What Leading SIEM Tools (Elastic, Wazuh, and Microsoft ) Get Right About Architecture Major platforms prove that architectural maturity is the only way to scale. Elastic: Their reference architectures focus heavily on workload separation. Scaling collection, indexing, storage, and search independently prevents one workload from overwhelming the platform. Wazuh: Their guidance shows how environments move to clustered deployments with redundant services and distributed indexers. Microsoft Sentinel: They treat the SIEM as a data platform where collection, retention, and automation are treated with the same importance as the alerts themselves. SentinelOne: Their approach emphasizes that detection and response are the ultimate goals, rather than just collecting as much data as possible. A Security Operations Roadmap for Growing SIEM Deployments Do not try to copy an enterprise architecture on day one. Build the next layer your environment actually needs. Environment Size Focus Pattern 1–50 endpoints Reliablecollection and basic detection logic. 50–250 endpoints Separate search resources from ingestion workloads. 250–1,000 endpoints Implement storage tiers and service redundancy. 1,000+ endpoints Full distributed architecture and automation pipelines. Scaling a SIEM is not about making the design complicated. It is about ensuring your collection, storage, search, and detection do not all depend on one fragile box. The organizations that scale successfully rarely start with perfect architectures. They gradually separate workloads, improve data quality, add redundancy, and invest in detection engineering as requirements grow. The sooner those patterns are introduced, the easier it becomes to scale without constantly rebuilding the platform. Related Reading Open Source SIEM Strategies Address Challenges for Small Teams OSSEC for Linux: Enhancing Monitoring and Risk Posture Management Linux Privilege Escalation Patterns and Mitigation Strategies Enhancing Linux Security With Ansible Automation Techniques Comprehensive Linux Security Tools and Hardening Best Practices 2026 AI-Driven Tools Enhance Linux Security Against Emerging Threats . A SIEM watching 20 endpoints is not doing the same job as one watching 500. More endpoints mean more. building, easier, scaling, open-source, deployments, start, simple, 'all-in-o. . Dave Wreski
Jun 04, 2026
•
102
 threat detectionsystem monitoringopen source security
Your Linux Logs Probably Aren’t Catching Attacks: 2026 Detection Gaps
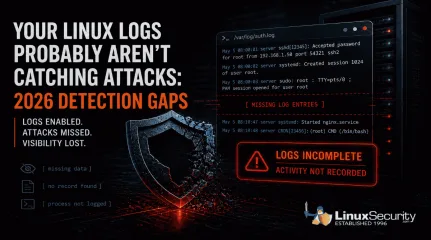
When a Linux system is compromised, the logs should tell you what happened. In a lot of cases, they don’t. . Linux systems generate logs by default, and most environments are already collecting data . That creates a sense of coverage, but during an investigation, those logs often fall short, and this isn’t just a Linux issue; it reflects how modern attacks behave across systems. What you actually get is fragmented activity. A login appears, a process runs, but nothing clearly explains how access was gained, what was executed, or how far the attacker moved, which forces you to piece together a timeline instead of reading one. That’s where things start to break down. Detection gets delayed, attackers stay longer than expected, and response slows down because the data doesn’t fully support what you’re trying to confirm. This isn’t a logging issue. It’s a visibility problem . It tends to break down in a few consistent ways: some attacks leave no trace, some alter the logs after access, others blend in with normal activity, and in some cases, the system never records what actually matters. The Real Problem Isn’t Missing Logs Most environments already have logging enabled. That’s not where things fail. The issue is what those logs actually capture. You can collect authentication events, system messages, and service logs all day. If none of that shows what an attacker did after access, you’re left trying to reconstruct a timeline from incomplete data. The same patterns show up over and over: Activity that leaves no trace Logs that get altered after access Actions that look completely normal Gaps where important behavior isn’t recorded Each one breaks visibility in a different way. When Attacks Leave Little or No Trace Most monitoring assumes something will hit disk. A file changes, a binary drops, or a service gets modified, and those events become the signals you rely on. When that doesn’t happen, there’s nothing to catchbecause the activity you’re watching for never triggers in the first place, which leaves your logs looking clean even while the attack is running. You don’t see a new file or a clear process tied to it, and there’s no alert to follow up on, so what you’re left with is a system that looks normal before and after, with no visibility into what happened in between. The attack runs, escalates privileges, and exits without leaving a clear trail. That gap is the problem. Copy Fail (CVE-2026-31431) is a good example.It allows a local user to escalate privileges entirely in memory. No files are written to disk, and from a logging perspective, nothing stands out, so the only thing you might see is routine kernel output like: kernel: [142.341205] [Firmware Bug]: TSC frequency mismatch... That’s all you see. The system looks healthy. Logging is active, and monitoring is running, but in reality, the attacker has already gained root access without leaving anything in your logs that clearly shows it happened. When Attackers Remove or Alter the Evidence Logs only help if you can trust them. If everything is stored locally, an attacker with enough access can change or remove it. Command history disappears. SSH traces get wiped. What’s left behind looks incomplete, or worse, completely normal. You might see something like this in auth.log: May 5 08:00:01 server sshd[12345]: Accepted password for root from 192.168.1.50 port 54321 ssh2 Looks legitimate, but that line doesn’t tell you how access was gained or what happened after. The entries that would explain that may already be gone. Real-world malware has done exactly this. Variants like Plague have been observed embedding into SSH authentication and stripping out traces of attacker activity while maintaining access. At that point, you’re not analyzing logs . You’re working with a filtered version of reality. When Malicious Activity Looks Normal Not every attack hides. Some just blend in. A valid loginshows up in auth.log. A sudo command looks like routine admin work. A process runs using standard system tools. From the system’s perspective, nothing is wrong. Attackers don’t always need to bypass logging. They just need to operate in a way that looks expected. Once they have access, everything they do can appear legitimate at the log level. You can see the login and the command that followed, but there’s nothing that tells you whether either one should have happened. Without context or correlation, those events don’t stand out as suspicious. They just blend into everything else, which is how a complete record of activity can still miss the attack. Timeline Discrepancy: Missing Intermediate Events The logs show a user login, followed by later activity such as a service starting or a session opening. What’s missing are the events in between. Some activity never shows up in a useful way, and that’s a different kind of failure. You might see the login and the process that followed, but not what was actually executed or what triggered it in the first place. In other cases, you see the result without anything that clearly explains how it happened. Things like credential access, memory interaction, or internal system behavior often don’t produce clear, actionable log entries. The system is still generating data, just not the data you need, which leaves gaps in the timeline right where the important actions took place. There’s no record of what processes ran immediately after the login, so the sequence is incomplete. Because of that, it’s not possible to clearly explain how the later activity was triggered or what actually happened during that gap. What This Means This creates a few problems during an investigation. It’s not clear whether the later activity came directly from that login or from something else running in the background. There’s also the possibility that actions took place that were never logged at all. Without those intermediatesteps, there’s no continuous chain of activity, which makes it difficult to understand the full scope of what happened. What the Logs Actually Show System and authentication logs confirm that a user logged in and that a session was created. Service or application logs show that something happened afterward, but they don’t show the steps that connect those two points. What to Check in Your Own Environment You don’t need new tools to spot the problem. You need to test whether your current setup can answer basic questions. If something happened right now, could you trace privilege escalation from start to finish without guessing? Could you see what commands were actually executed, not just who logged in? Could you confirm that the logs haven’t been altered or removed, and that events are tied to alerts rather than just stored? If you can’t answer those quickly, the issue isn’t logging. It’s visibility, and that gap only shows up when you need it most. Why Logging Alone Isn’t Enough Logging on its own doesn’t give you visibility. It just gives you data. Systems can look fully monitored and still miss the events that matter . Not because logging is broken, but because it doesn’t capture the right activity, doesn’t protect the data, or doesn’t help you understand what you’re seeing. If your logs can’t show what an attacker actually did, they’re not helping you detect them. What’s Next: To bridge these gaps, you have to look beyond traditional files and logs. In our upcoming posts, we will explore how implementing eBPF-based monitoring, File Integrity Monitoring (FIM), and immutable centralized logging can restore your visibility. Want to stay ahead of modern Linux threats? Subscribe to our newsletter to get actionable cybersecurity insights, in-depth technical breakdowns, and best practices delivered straight to your inbox. . Linux logs often miss critical attack details, causing gaps in visibility and hinderingdetection effectiveness during investigations.. Linux logs, detection issues, visibility gaps, log analysis, threat response. . MaK Ulac
May 05, 2026
•
102
 threat detectionperformanceeBPF
Auditd vs eBPF: Modern Approaches to Linux System Monitoring
Most teams rely on logs to understand what’s happening on a Linux system. Think of a log like a digital paper trail; every action leaves a trace somewhere. The assumption is that if something goes wrong, you can go back and piece the story together using these records. . That approach worked well when systems were small, and attackers moved slowly. However, that logic breaks down as systems grow. Modern attacks move fast, often chaining different actions together in seconds. Logs get noisy quickly. Important signals get buried under thousands of "normal" events, and by the time a human reviews them, the damage is already done. This is where the conversation around Linux security and threat detection is changing. Auditd takes the traditional approach of recording everything it possibly can. On the other hand, eBPF focuses on filtering activity the very instant it happens. Understanding the difference between them is the key to modern system visibility. What Auditd Was Built to Do The auditd Linux tool is a part of the Linux auditing system. Its job is simple on paper: record what happens on a system so you can review it later. To understand it, you need to understand system calls. Every time a program interacts with the kernel—like opening a file, starting a process, or changing permissions—it makes a system call. Auditd hooks into those calls and logs them based on rules you define. You can see how those rules are structured in the [suspicious link removed]. If a user opens a sensitive file or fails a login attempt, Auditd can record that event. It writes everything to log files, usually on disk, where it can be sent to other systems. This is why compliance teams like it. You get a full audit trail of who did what, when, and on which system. That level of detail matters during an investigation. But there is a tradeoff. Auditd doesn’t decide what is important in the moment. It just records based on your rules. Those rules often end up being very broad because missing somethingis worse than logging too much. This generates a lot of data. Filtering usually happens later on a different system, and that delay is where things start to slip. What eBPF Does Differently eBPF changes where the thinking happens. Instead of collecting every single piece of data and deciding what matters later, it lets you run small, smart programs directly inside the Linux kernel. This sounds technical, but here is what it means in practice: these programs sit at the very heart of the system. According to the official eBPF overview , they can watch system calls, network traffic, or even specific functions as they run. Instead of logging every single time any file is opened, you can write a tiny program that says: "Only tell me if a sensitive folder is accessed by a program I don't recognize." Everything else is ignored before it ever leaves the kernel. This is the power of ebpf monitoring. You reduce the "noise" at the source. You aren't moving mountains of data; you are only moving the data that actually has meaning. From an ebpf security perspective, it’s about having better control over your visibility so you don't drown in it later. System Spotlight While Auditd acts like a security camera recording everything for later review, eBPF acts like a smart bouncer at the door, deciding in real-time who belongs and who doesn't before they even enter the room. Key Difference: Where the Work Happens Most Linux monitoring tools follow a "pipeline" model: collect everything first, and analyze it later. Auditd fits this model perfectly. It captures an event, writes it to a file, and relies on a human or another piece of software to interpret it. eBPF breaks that pattern. It processes the event inside the kernel—right where it occurs. It decides immediately if the event should be kept or thrown away. This shift matters more than it might seem. By moving less data, you save storage space, use less internet bandwidth, and spend less time parsing logs. It’s the differencebetween recording 24 hours of security footage and only having a camera that turns on when it sees someone climbing a fence. Performance and System Impact Performance is where the differences become very obvious. When you are running runtime security tools, you have to consider how much "tax" they put on the system’s CPU and memory. Auditd writes a steady stream of data to the disk. On a busy system, this creates "overhead"—basically, the computer spends more time recording what it is doing than actually doing its job. This impact has been studied in detail in performance reports from EuroBSDCon and through practical analysis by experts like Brendan Gregg . eBPF reduces this pressure. Because it filters the data early, there is less data to move around. However, it isn't "free." Since eBPF programs run in the kernel, a poorly written program can still slow things down. It’s like a filter on a faucet: if the filter is too thick, the water won't flow, no matter how clean it is. What This Means for Threat Detection Threat detection is a race against time. The gap between when an attacker does something and when a security team sees it determines who wins. With Auditd, detection usually happens later in a central log platform (often called a SIEM). This creates a delay—sometimes seconds, sometimes minutes. eBPF closes that gap. Because it makes decisions at the source, it can surface suspicious behavior the moment it happens. This leads to a much faster response. It also works better for network security monitoring, where seeing a suspicious connection immediately is much more valuable than reading about it in a report the next morning. Real-World Impact: The Detection Gap To see why this timing matters, we can look at the security challenges faced by Citibank in recent years. In recent data breach reports , it was revealed that unauthorized actors exploited web vulnerabilities to gain access to customer information. In a traditional setup using Auditd, the bank wouldhave a perfect record of the breach after the fact. Investigators could see exactly which records were touched. But for a global bank, the problem isn't just knowing you were robbed—it's stopping the theft while it's happening. As security experts often point out, banks are reluctant to admit breaches because, by the time the logs are analyzed, the "booty" is already gone. By using eBPF-based tools, teams can move from "hindsight" to "real-time." Instead of waiting for a log to be written to a disk and then sent to a server, eBPF can flag the suspicious behavior the microsecond it occurs in the kernel. It turns a "lawsuit waiting to happen" into a "threat blocked at the door." The Detection Gap: In modern breaches, the "Time to Detect" (TTD) is the only metric that matters. Auditd helps you understand the past , while eBPF helps you control the present . Where Auditd Still Makes Sense Despite the new technology, Auditd is not dead. It still makes sense in environments where "completeness" is the most important thing. If your organization is required by law to keep a record of every single action for legal reasons, Auditd is a proven, reliable tool for that job. It also works well on smaller, stable systems where there isn't a massive flood of data. Sometimes, you don't need the fastest technology; you just need a reliable record to explain what happened after the fact. Where eBPF Is Gaining Ground eBPF is becoming the standard for modern environments like the "Cloud" and "Containers." These systems are very fast and generate a lot of unpredictable activity. These setups need visibility that doesn't slow the system down. The industry is moving in this direction quickly. Even Microsoft has integrated eBPF support into its Linux security tools. The trend is clear: the world is moving away from raw, bulky logs and toward "smart" filtering. Why Many Teams Use Both In the real world, it isn’t a competition. Many teams use both tools together because they solve differentproblems. Auditd provides the long-term, historical record for the lawyers and auditors. eBPF provides real-time visibility for security responders. Using them together covers the gaps that either tool would leave open if used alone. What to Watch For: Spotting the Escape If you’re defending these systems, you can’t just wait for a summary report. You need to know what a breakout looks like while it's happening. Depending on your Linux monitoring tools, that data is going to look very different. The Auditd Trail When an attacker tries to escape, they usually need to interact with sensitive parts of the host. In Auditd Linux, you’ll see this as a flood of system calls. You might see a container suddenly trying to use mount() to grab a host directory or execve() to run a shell with root privileges. The problem? On a busy server, Auditd is recording every mount and every process. By the time you find the one "evil" line in a 50GB log file, the attacker has already moved on. It’s a great record for a post-mortem, but it’s a tough way to catch a live runner. The eBPF Signal This is where eBPF monitoring changes the game. Instead of looking at a list of everything that happened, you can set "tripwires." For example, you can use ebpf security tools to alert you only if a container process attempts to access a file outside of its own virtual environment. Because eBPF lives in the kernel, it sees the attempt in the microsecond it happens. It’s the difference between reading a police report the next day and having a silent alarm go off the moment someone touches the safe. The Visibility Gap Traditional tools often see what is inside the container, but they miss how the container is talking to the host. Real-time threat detection requires seeing that interaction as it happens, not after it's logged. A Pragmatic Path Forward If you’ve already got Auditd running, don't feel like you have to rip it out tomorrow morning. It’s a workhorse.It does exactly what it was built for—creating that rock-solid, line-by-line record that auditors and investigators live for. But here’s the harder question you have to ask yourself: Are you actually catching threats as they happen, or are you just doing a high-tech autopsy after you've already been breached? If you're managing cloud-native apps or complex container setups, raw logs usually aren't enough. They're too slow. Adding eBPF-based monitoring into the mix fills that gap. It gives you a way to filter for the high-priority events right at the source, so you aren't drowning in data later on. Most teams I talk to don't actually pick a "winner" here. They use both. Auditd handles the history; eBPF handles the "right now." At the end of the day, it just comes down to what you need more: a perfect paper trail or an immediate answer. Conclusion: It’s Not About Replacing Auditd Auditd still has a role; it provides the complete, reliable record that compliance teams require. eBPF solves a different problem by reducing noise and improving visibility in real-time. The real shift is in the approach. Older systems collect everything and figure it out later, while newer systems decide what matters immediately. Most teams end up somewhere in the middle, balancing historical compliance with modern speed. Stay Ahead of the Curve If you want to keep up with how the Linux kernel and security landscape are evolving, subscribe to our Linux Security Newsletter . We deliver the latest on eBPF, threat hunting, and system hardening directly to your inbox so you never miss a beat. . That approach worked well when systems were small, and attackers moved slowly. However, that logic b. teams, understand, what’s, happening, linux, system, think. . MaK Ulac
Apr 20, 2026
•
102
 security toolcybersecuritythreat detection
What is Nmap? How To Use It Effectively for Network Security
Nmap, short for “Network Mapper,” is an open-source network security tool for discovery and auditing. It is one of the most widely used network mapping tools for system administrators to search for hosts and services within a network. . Nmap stands out among other monitoring and vulnerability scanning solutions used by cybersecurity professionals because it is free, incredibly flexible, portable, well-documented, and simple to use. Various abilities are combined into one package with Nmap, which makes those familiar with command-line interfaces much more comfortable. This article will discuss how to use it for port scans, other useful Nmap functions, and why threat actors also use port scanning. What is a Port Scan? How Do You Run It? Port scans are a type of vulnerability scanning used to identify open ports on a server that send or receive data. Open ports can lead to data and network security issues, making your company more susceptible to cloud security breaches. To run a port scan, you enter the domain or IP address into the port scanner tool, which then examines the entire network for any cybersecurity vulnerabilities related to open ports. Network mapping with port scans is an effective way to find network security threats within a system. As a result, they can help you to close ports and protect your business. What are Ports and Port Numbers? A port is the starting and finishing point of online communications. Ports are typically linked to a specific function or operation, are software-based, and are managed by the company using the service. Port numbers are identification codes that help a server manager determine where a network packet should be sent. This allows a steady stream of communication between two parties. However, open ports without the proper configuration are an invitation for network intrusion and a whole host of preventable security threats. How Do You Scan Ports on Nmap? The simplest way to start port scanning is to enter nmap , where is the name of a network host. From this command, Nmap converts the hostname to an IP address, pings the host, and then returns a list of port statuses for the most popular 1,000 ports listed in nmap-services. This report categorizes all ports as open, closed, filtered, unfiltered, open|filtered, or closed|filtered. Similar results are condensed into a single line, while notable statuses are highlighted for the administrator to read. Can You Detect an Nmap Scan? Nmap scans run by cybercriminals are not always picked up quickly, if at all. Threat actors can use Nmap to find vulnerable server hosts that they will target for an attack. Modern forms of port scanning detection can pick up on Nmap scans, but the best defense against hostile scanners is to stay a step ahead by preemptively scanning your ports. It is important to be aware of any and all cybersecurity vulnerabilities within your company. Routine network mapping scans will notify you of open ports so you can close them before a breach. Within Nmap, there are options listed that you can select to verify your system has proper data and network security with scanners. How to Scan with Nmap Here are a few of the more popular scans customers use with Nmap: Ping Scans The most basic function of Nmap is to identify hosts on your network, which can be done through a ping scan. This scan logs all IP addresses and hosts without sending packets to the admins. You can run more commands on the found hosts to examine them more thoroughly. Run the following command to execute a ping scan: # nmap -sp 192.168.0.1/22 Host Scans Host scans are a powerful technique that can be used to verify data and network security. They send ARP request packets to all the hosts on your network, who respond with the ARP packet status and MAC address. Run the following command to execute a host scan: # nmap -sp OS and Services Scans Nmap can run scans to detect the operating system, version, and services on a single or numerous devices.Detection scans are important to the enumeration process when conducting network penetration testing. It's critical to know where susceptible devices are on the network so they can be repaired or replaced before any attacks on network security can get to them. Run the following command to detect OS and Services: # nmap -A How Can You Prevent Port Scanning? You can prevent a port scan by installing a super-strong firewall. This keeps external networks from looking at your business’s protection (or lack thereof). If a firewall sees that someone is trying to execute a port scan, the firewall will shut the port scan down. How Do Bad Actors Use Port Scanning as an Attack Method? Cybercriminals will use port scanning to identify cybersecurity vulnerabilities in your company’s system. Network mapping helps them to find the easiest ways to access your sensitive information and collect your data. Threat actors will scan the company, identify where they can break into your business assets, and execute cloud security breaches. Final Thoughts on Port Scanning with Nmap Nmap can be used to perform various scans to gather information for network discovery and auditing. Vulnerability scanning provides actionable intelligence and ensures that your company's data and network security is not an unknown variable. This way, administrators can detect weaknesses before they become a problem. Using Nmap or other network mapping tools for firewall pentesting is an important step towards improving your overall security posture. . Nmap stands out among other monitoring and vulnerability scanning solutions used by cybersecurity pr. short, “network, mapper, open-source, network, security, discovery. . Andrew Kowal
Apr 17, 2026
•
102
 network monitoringthreat detectionsecurity technology
Understanding Intrusion Detection Systems
Modern networks generate more traffic than most teams can realistically watch. Internal services talk constantly, cloud workloads spin up and down, and even well-configured defenses don’t stop every attack. Stolen credentials still get used. Misconfigured services sit exposed longer than anyone expects. Sooner or later, something slips through, and the first sign usually shows up in the logs. Intrusion detection systems help surface that activity, giving administrators and analysts visibility into connections, authentication attempts, and network behavior that deserves a closer look.. What Is an Intrusion Detection System? An intrusion detection system (IDS) monitors network or system activity to identify suspicious behavior, policy violations, or patterns associated with known attacks. It doesn’t block traffic or shut connections down. Intrusion detection systems watch what is happening across the environment and generate alerts when activity starts to resemble techniques security teams have learned to recognize over time. Most deployments end up tracking connection attempts, authentication activity, protocol behavior, and traffic patterns moving between hosts. The system compares those events against known attack signatures and traffic patterns seen during common intrusion activity. When a match appears, the IDS logs the event and generates an alert so someone can review the connection and the host involved. What that alert means still has to be figured out. Sometimes it’s a misconfigured service hammering another host with retries. Sometimes it’s an automated scan moving across the network looking for exposed services. And sometimes it’s the early stage of an intrusion, which is where the investigation moves into the broader process of intrusion detection response . How Do Intrusion Detection Systems Detect Threats? Intrusion detection systems detect threats by watching network traffic and system activity for patterns that shouldn’t be there. In most environments, workhappens inside network sensors inspecting packets, track connections, and record events as traffic moves between hosts. After reviewing enough alerts, certain signals start repeating. Some are tied to known exploits. Others just look wrong compared to the rest of the network that day. That’s why IDS platforms usually rely on several detection approaches at the same time. Signature-based detection This is the most familiar approach. The IDS compares packets and events against a library of known attack signatures. When traffic matches one of those patterns, the system logs the event and raises an alert. It works well for exploits that have already been documented, although signatures have to stay current or new techniques slip past unnoticed. Anomaly detection Some activity doesn’t match a signature at all. Instead, it stands out because it behaves differently from the rest of the environment. A server is suddenly pushing far more data than usual. Authentication attempts appear at odd hours. Systems that normally never talk to each other. Those shifts can reveal attacks that rule-based detection never catches. Behavioral monitoring Intrusions rarely appear as a single event. They show up as a sequence. A login attempt appears, then another. Eventually, one succeeds. A few minutes later that host begins reaching out to internal systems it has never contacted before. Each step alone might look ordinary. Together, they start to tell a different story. Traditional detection still has limits. Encryption hides packet contents, attackers change techniques constantly, and large networks generate more alerts than analysts can realistically review. That’s why newer detection models increasingly rely on behavioral analysis and traffic patterns, an approach explored further in modern IDS approaches . What Is the Difference Between IDS and IPS? The difference between intrusion detection and prevention systems comes down to visibility versus enforcement. Anintrusion detection system monitors network traffic and raises alerts when activity looks suspicious, while an intrusion prevention system sits inline and can block that traffic when a rule triggers. That placement changes how the systems behave on a real network. IDS watches connections, logs events, and surfaces activity that deserves investigation. IPS becomes part of the traffic path itself, so when a rule fires, the system can interrupt the connection or terminate the session. The operational tradeoffs between detection and prevention are explored further in IDS vs IPS . Detection keeps the network untouched while giving teams visibility into suspicious activity. Prevention introduces control, and with that control comes responsibility for the decisions the system makes. False positives make the difference obvious. An IDS alert appears for review. An IPS rule can interrupt application traffic or block legitimate users if the system reacts too aggressively. What Happens After an IDS Detects Suspicious Activity? After an intrusion detection system flags suspicious activity, the process moves into intrusion detection response. Detection surfaces the event, logs it, and generates an alert. Most environments end up working through roughly the same sequence. Alert generation: The IDS records the rule match and produces an alert describing the connection, host, or traffic pattern that triggered detection. Initial review: Someone looks at the alert details first. That usually means checking surrounding logs, connection history, and related system activity. Investigation: If the activity still looks suspicious, the analysis goes deeper. The question becomes whether the behavior reflects reconnaissance, credential abuse, or something mundane like a misconfigured service retrying requests. Response decision: Only after that context is understood does an actual response decision take place. The real work is figuring out whether the alert reflects a genuine intrusionattempt or something routine that simply looks unusual. Alerts rarely explain the situation on their own. A connection pattern might indicate scanning activity, repeated authentication attempts, or a system behaving unexpectedly. The surrounding context is what determines which one it is. Response also introduces operational risk. Acting too quickly can disrupt legitimate services, while waiting too long can allow an attacker more time inside the environment, which is why the investigation stage naturally leads into intrusion detection response once analysts understand what the alert actually represents. How Do Most Organizations Measure IDS Effectiveness? Organizations measure IDS effectiveness through IDS performance testing and intrusion detection system metrics that show whether the system can inspect real network traffic without missing suspicious activity. In practice, this becomes a balance between traffic volume, inspection depth, and the quality of alerts analysts receive. Throughput: How much traffic the IDS can process before packets begin slipping past inspection. High-traffic environments quickly expose the limits of a detection sensor. Latency: Inspection takes time. If analysis adds too much delay, it can affect application performance or create bottlenecks in busy network segments. Packet inspection capacity: IDS sensors track sessions, parse protocols, and apply detection rules at the same time. The question becomes how much traffic the system can fully inspect without losing visibility. Detection accuracy: Alerts need to reflect real attack activity. Systems that miss known attack patterns or misidentify normal traffic create gaps in monitoring. Alert noise: Review enough alerts, and you’ll notice how quickly unnecessary ones add up. When analysts spend most of their time filtering harmless events, real intrusion attempts become harder to spot. These measurements usually come from IDS performance testing , where teams observe how detectionsystems behave under real network conditions and traffic loads. How Are Intrusion Detection Systems Deployed? Intrusion detection systems are usually deployed by placing sensors where they can observe meaningful network traffic. The goal is visibility. If the system cannot see the traffic where authentication, service connections, or lateral movement occur, it cannot detect much. Most deployments end up coming down to a few practical decisions: Sensor placement: Sensors are positioned where traffic converges. Network boundaries, internal segments that host sensitive systems, or shared infrastructure where many connections pass through. Network visibility: The IDS needs access to traffic streams where authentication attempts, service connections, and data movement occur. Without that visibility, the system simply never sees the activity it is supposed to detect. Integration with monitoring systems: IDS alerts rarely stand alone. Most deployments feed event data into security monitoring platforms so analysts can review IDS alerts alongside logs and other network activity. Many intrusion detection tools exist, but Snort intrusion detection is often used as the reference example because it clearly demonstrates how rule-based network detection works in practice. How Does Snort Detect Network Intrusions? Snort detects network intrusions by inspecting packets moving across the network and evaluating them against detection rules that identify suspicious traffic patterns. As one of the most widely used intrusion detection tools, Snort focuses on analyzing traffic behavior as it moves between systems. Packet inspection Snort analyzes packets as they move through the network, examining headers, payload data, and session information. Rule evaluation Traffic is compared against detection rules describing known attack behavior or suspicious packet patterns. Protocol analysis The system evaluates whether protocols behave as expected during communication.Malformed packets, unusual requests, or protocol abuse can signal exploitation attempts. When one of these checks identifies suspicious activity, Snort records the event and generates an alert so analysts can review what the system observed. Many teams first encounter these detection techniques when working with tools like Snort. Our guide on network intrusion detection using Snort walks through how packet inspection, rule evaluation, and protocol analysis surface suspicious traffic. How Are IDS Alerts Used in Security Operations? IDS alerts surface suspicious activity so security teams can investigate what is happening on the network. Through IDS alerting, detection systems generate events that feed into broader security monitoring workflows. Most alerts move through a simple operational pipeline. First, the detection system generates an alert when traffic matches a rule or suspicious pattern. The event is then recorded so analysts can review it alongside other network activity. From there, the alert becomes part of ongoing security monitoring, where patterns across systems and time begin to emerge. Seen once, an alert might not mean much. Seen repeatedly across different hosts, it starts to look like reconnaissance or credential probing. When alerts arrive quickly, the sequence becomes easier to understand. Real-time IDS alerting helps analysts watch suspicious activity develop instead of reconstructing it afterward. Are Intrusion Detection Systems Enough to Secure a Server? Intrusion detection systems help monitor server activity, but they are not enough on their own to secure a system. IDS identifies suspicious behavior on the network. It does not confirm whether the system itself remains secure. What IDS does Observes network activity Flags suspicious connections or authentication attempts Generates alerts when behavior matches known attack patterns What other controls handle Verifying system configuration and software integrity Confirmingthat permissions and services remain secure Checking whether recent changes introduced a new risk Detection tells you when something unusual might be happening. Determining whether the system itself is still trustworthy usually involves taking time to verify Linux server security during regular security checks. . Explore the realm of Intrusion Detection Systems (IDS), examining their various forms and significance for safeguarding networks in the contemporary digital environment.. Intrusion Detection Systems, Cybersecurity, Host Monitoring, Network Traffic, Security Infrastructure. . Mak Ulac
Feb 16, 2026
•
102
 threat detectioncloud securitysecurity consulting
Cloud Security Revolution: Strategies and Trends for Cyber Defense
You know, it wasn't that long ago that "cybersecurity" meant a bunch of blinking lights in a server room and a team huddled around monitors, mostly reacting to things that had already gone wrong. But the cloud? The cloud has flipped that whole script. Cloud security in cybersecurity isn't just an add-on; it's fundamentally changing how we think about keeping our digital world safe. . Think about it. Businesses are practically stampeding to the cloud for all sorts of reasons—the flexibility, cost savings, and all those advantages of cloud computing in cybersecurity are hard to ignore. But with all that valuable data and those critical applications in the cloud, making sure it's locked down tighter than a drum is paramount. This is why cloud security is driving a massive shift in the cybersecurity services we see today. Let’s explore how cloud security is transforming cybersecurity services, the advantages it offers, and practical tips for crafting your own cloud security strategy. From Building Walls to Securing Thin Air: The Evolution of Cybersecurity Remember when cybersecurity was all about building these big, thick digital walls around your physical servers? You had your firewalls, intrusion detection systems, and a team of security folks acting like guards at the gate. But the cloud? Those walls just dissolved. Your data and applications could be spread across the globe, living on infrastructure you don't even see. That's why cloud security in cybersecurity is such a game-changer. It's forced us to rethink how to protect your data in the cloud in a completely new way. Instead of reacting to threats that try to breach your perimeter, the focus now is on building security directly into the cloud environment itself. This has led to a whole new wave of cloud-based cybersecurity solutions designed specifically for the unique challenges and opportunities of the cloud. The Cloud Security Advantage: It's Not Just About Being Different, It's Often Better Cloud security incybersecurity offers some fundamental advantages compared to the old on-premises model. For one thing, the sheer scale and flexibility of the cloud mean that your security can scale along with your business needs. That's a huge advantage of cloud security and a significant benefit of cloud computing in cybersecurity. You're not stuck with a fixed capacity that you might outgrow or underutilize. Let's be honest: The cost benefits of cloud consulting services often extend to security. Using cloud-based cybersecurity solutions can sometimes be more cost-effective than buying and managing all your security hardware and software. This makes cloud security even more compelling for businesses of all sizes. Plus, big cloud providers like AWS offer some awe-inspiring AWS cloud security benefits. They have armies of security experts and invest a fortune in infrastructure security. This means you can often tap into security capabilities that would be incredibly difficult and expensive for most companies to build independently. Following AWS security best practices is usually wise for anyone on the platform. That's a real advantage of cloud security. Let's not forget the built-in resilience. Cloud platforms are typically designed with redundancy and failover in mind, which can help ensure that your security services stay up and running even if the infrastructure has a hiccup. The New Toolbox: Cloud-Based Solutions Are Taking Center Stage This paradigm shift has allowed for the birth of new clouds centered on cybersecurity solutions. These aren't your run-of-the-mill security tools sitting comfortably above the cloud; rather, they are often designed from scratch to take full advantage of the peculiar opportunities offered by the cloud. Perhaps think of Security as a Service, with cloud-delivered security services ranging from threat intelligence to intrusion detection, exfiltration, and vulnerability scanning . Many managed security service providers are building their complete services around the cloudto deliver security and flexibility. We also see rekindled interest in cloud-native security tools specifically developed for securing workloads and data across AWS, Azure, and GCP. This security toolset closely integrates with cloud provider security services, thus making life more manageable from a management standpoint. The Guiding Principles: Crafting Your Cloud Security Strategy Just like with traditional cybersecurity, a well-defined cloud security strategy is crucial. This strategy involves carefully considering several key areas: First, you should learn cloud data protection methods; this includes encrypting sensitive information, applying strong access controls, and implementing best practices in Cloud data security. The place to know where your data is kept, who has access to it, and what measures are in place to prevent the data's unauthorized access or accidental leaks. Then there's identity and access management (IAM). In the cloud, with resources potentially spread across different services and regions, having robust control over who can access what is more important than ever. Network security in the cloud also has its nuances. You need to think about how you're segmenting your virtual networks, controlling traffic flow, and protecting your cloud resources from external threats. Of course, you need to have a plan for detecting and responding to threats in the cloud. This means having the correct monitoring tools and knowing precisely what to do if a security incident occurs. Finally, compliance and governance are essential, especially when dealing with regulated data. Your cloud security strategy must align with all the relevant rules and regulations. What's Hot Right Now: Cloud Security Trends to Watch The world of cloud security in cybersecurity is constantly evolving, but some key cloud security trends are really shaping the landscape right now. One big one is the move towards a zero-trust security model. You shouldn't automatically trust any user ordevice, even if they're inside your network. You need to verify everything. Security automation and orchestration are also becoming increasingly vital. With the speed and scale of the cloud, automating security tasks is often the only way to keep up with potential threats and manage your security effectively. Another trend is the growing importance of cloud-native security. This involves building security directly into your cloud application development and infrastructure from the start rather than trying to bolt it on as an afterthought. Finally, DevSecOps, which is all about integrating security practices into the software development lifecycle, is gaining traction as organizations realize that security needs to be a shared responsibility throughout the development process. The Big Three: Security on AWS, Azure, and GCP The major cloud providers – AWS, Azure, and GCP – all offer a wide range of security services and have distinct approaches to the cloud security model. AWS, for example, boasts a massive suite of security tools and emphasizes the benefits of using its cloud security platform. Following AWS security best practices is a must for anyone building on AWS. Azure also offers a comprehensive set of security offerings, and many organizations choose it for its integration with Microsoft's other products. GCP, while sometimes seen as the newer kid on the block, has been making significant strides in its security capabilities. When companies are trying to decide between AWS, Azure, and GCP , security is almost always a major deciding factor. Sharing the Responsibility: The Cloud Security Model Explained It's essential to understand the shared responsibility cloud security model. In the cloud, security isn't just the provider's job; it's a team effort. The provider is responsible for the security of the cloud itself—the physical infrastructure, the networking, and the virtualization. But you, the customer, are responsible for the security in thecloud—your data, applications, and configurations. Getting this model right is fundamental to your cloud security strategy. The Tools You'll Use: Your Cloud Security Toolkit This is akin to a whole ecosystem of cloud security tools and technologies aimed at helping secure the cloud environment. This means everything from the security services offered by AWS, Azure, and GCP to various third-party security solutions. You will find tools for identity and access management, data encryption, network security, threat detection and response, vulnerability management, and compliance. The cloud security tools and technologies you require will depend on your specific needs and your cloud platforms of choice. What Scares Us: Common Cloud Threats Only here should we discuss the threats that organizations need to monitor regarding cloud security. These relate to data breaches incurred from misconfiguration, unauthorized access via credential theft, insider threats, and highly sophisticated attacks aimed at cloud environments. Any such threats to cloud security would help outline some strong possible defenses. Pro Tips:- Cloud computing is not the same as cloud security. It's easy to get confused, but cloud computing and cloud security are distinct. Cloud computing means delivering computing services over the Internet. On the other hand, cloud security is the subset of cybersecurity that deals with securing the cloud environment and data. One is the platform; the other is the means. Getting the Right Help: The Value of Cloud Consulting Services I can't stress enough how valuable cloud consulting services can be when navigating the complexities of Cloud security in cybersecurity. These experts can provide invaluable guidance, help you implement Cloud Security Best Practices, and ensure your security strategy aligns perfectly with your business objectives and any regulatory requirements you need to meet. The Gold Standard: Cloud Security Best Practices (A Reminder) Let's quickly recap somekey Cloud Security Best Practices: enforce strong access controls, encrypt your data at rest and in transit, implement data loss prevention measures, conduct regular security audits, and maintain compliance with all relevant regulations. These are the cornerstones of a solid cloud security strategy. With more organizations using a mix of different cloud providers, the need for Multi-Cloud Security Solutions is becoming increasingly apparent. These solutions are designed to give you a unified view of your security posture across all your cloud environments, simplify management, and help you maintain consistent security policies. Our Final Thoughts on How Cloud Security is Transforming Cybersecurity Services So, to sum up, Cloud security in cybersecurity isn't just a fad—it's a fundamental shift in how we approach digital security. It offers some compelling advantages and is driving the development of innovative cloud-based cybersecurity solutions. By understanding the cloud security model, implementing cloud security best practices, and leveraging the right cloud security tools and technologies, organizations can confidently embrace the power of the cloud while keeping their valuable data safe. The future of cybersecurity is looking cloudy, and that's a good thing! . Explore how cloud security is revolutionizing cybersecurity strategies, enhancing safety and efficiency in modern digital practices.. wasn', cybersecurity', meant, bunch, blinking, lights, server. . Brittany Day
Mar 28, 2025
•

Get the latest News and Insights
Get the latest Linux and open source security news straight to your inbox.
Community Poll
Should Linux servers automatically install security updates?
Search Topics
Powered By

Linux Security - Your source for Top Linux News, Advisories, HOWTOs and Feature Releases
QUICK LINKS
subscribe to newsletters!
Like staying secure? So do we.
Sign up for updates, tips, and alerts!