Overly broad permissions can turn one compromised account into a much larger security problem. Learn how to reduce unnecessary access, review privileges, and apply least privilege across modern Linux systems. Review Linux Privileges×


Stay Ahead With Linux Security HOWTOs
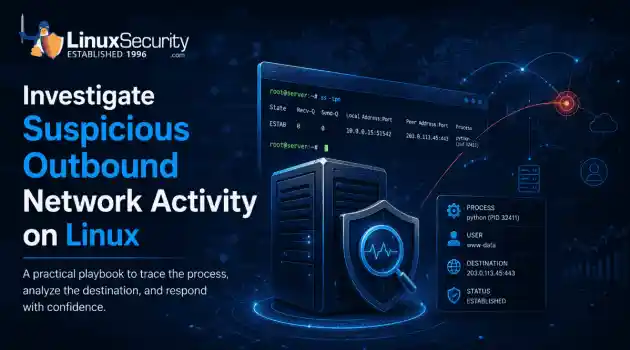
How to Secure My Network incident response network traffic
incident response network traffic Imagine logging into a production Linux server for routine maintenance and noticing background network activity connecting to an unfamiliar external IP address. Your endpoint protection agent is not popping up with an alert, there is no service failure, and on the surface, the system appears to be running normally. . For Linux administrators and security teams, such a situation is a moment of truth: Is this activity a sign of active intrusion or just a tool that was overlooked in the course of...
 Jul 21, 2026
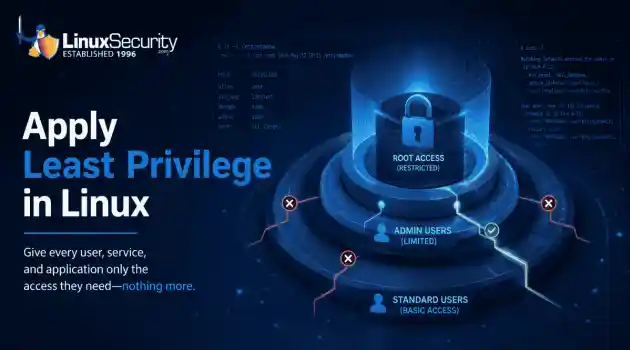
How to Harden My Filesystemsystem hardening open source security
system hardening open source security We all spend a lot of time defending our systems from external threats, but the amount of damage an attacker can cause often depends on what happens after they get in. A single compromised account doesn't always lead to a major incident. The real danger begins when that account has far more access than it actually needs. . That's exactly what the principle of least privilege is designed to prevent. By limiting users, services, and applications to only the permissions required for their jobs,...
Jul 20, 2026
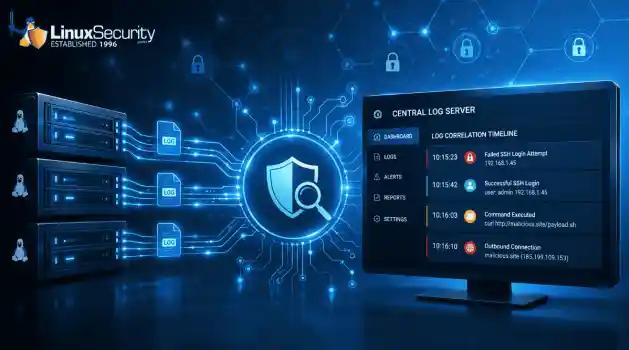
How to Learn Tips and Tricksthreat detection system monitoring
threat detection system monitoring For small security and IT teams, the "enterprise" dream of a fully automated SIEM often feels like a distant luxury. It’s a vision built on massive budgets and dedicated engineering teams—things that, frankly, most of us don't have. But here is the reality: you don’t need a six-figure platform to maintain a secure environment. . Linux systems are, by design, incredibly verbose. Every time a user authenticates, a process executes, or a configuration file changes, your system creates a record of...
Jul 17, 2026
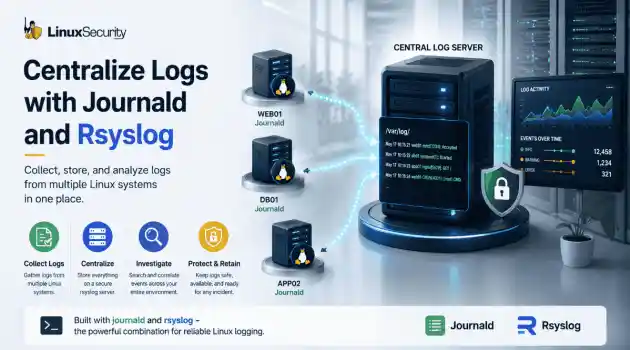
How to Learn Tips and Tricksnetwork security centralized logging
network security centralized logging Linux systems generate a steady stream of authentication, service, kernel, and application logs. On most systems, those logs never leave the machine that created them. If you're responsible for ten or twenty servers, that means checking each one separately. If one disappears before you can investigate it, its logs may disappear with it. Centralized logging solves that by sending log messages to another server as they're created. Instead of searching every machine, you have one place to review...
Jul 15, 2026
How to Secure My Networksecurity advisory audit
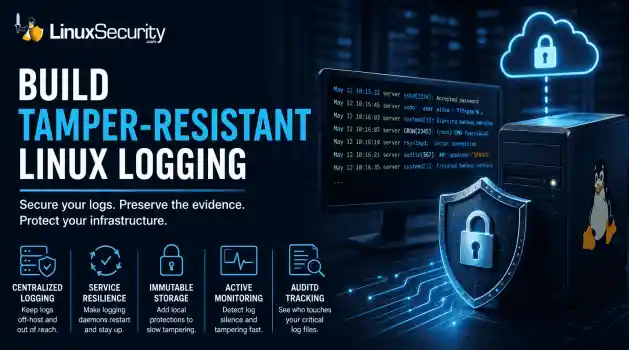
security advisory audit When you’re digging through an incident, your logs are the only thing you can actually trust. The problem is, attackers know that too. If someone gets root on your server, their first move is almost always to delete the evidence and cover their tracks. . If you aren't actively protecting your logs, you're basically flying blind the second a breach happens. It’s a miserable feeling to realize you have no idea what an attacker did because they wiped the logs before you even got there. In this...
Jul 11, 2026
 Refine HOWTOs
X Clear Filters
Get the latest News and Insights
Get the latest Linux and open source security news straight to your inbox.
Community Poll
Should Linux servers automatically install security updates?
Loading...
Explore Latest Linux Security HOWTOs
We found 11 articles for you...
166
 security practiceslinuxmonitoring tools
Detection-as-Code for Linux: Building Security Rules That Last
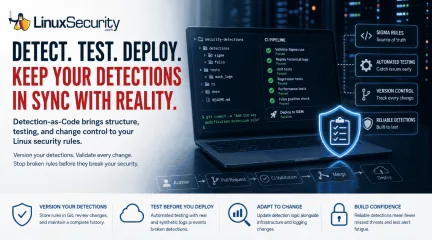
One of the easiest mistakes to make in detection engineering is assuming a rule keeps working simply because nobody has touched it. Most of the time, nobody removes the rule. Nobody disables it. It just gets forgotten. . A few months later, someone upgrades a distribution, changes how SSH keys are managed, replaces a logging agent, or migrates an application to containers. The detection is still enabled, but it's watching an environment that no longer exists. The alert everyone expected never comes because the rule quietly stopped matching reality. I've seen teams spend hours debugging a SIEM only to discover nothing was technically broken. The detection simply hadn't kept up with the Linux systems it was supposed to monitor. Detection-as-Code grew out of that problem. Instead of treating detections as something you configure once inside a security platform, they're managed like any other engineering project. Rules live in Git, changes are reviewed, tests run automatically, and every modification has a history. The technology isn't the interesting part. The discipline is. What Is Detection-as-Code? Detection-as-Code moves the detection out of the SIEM and into a repository. The rule becomes another file that changes alongside the systems it depends on, rather than being edited directly in the platform and forgotten until an alert goes missing. That matters because detection rules depend on assumptions about the environment. A rule looking for changes to ~/.ssh/authorized_keys assumes those file events are being logged exactly the way they were six months ago. If someone replaces auditd with eBPF or moves those workloads into containers, those assumptions break. Keeping your rules in Git doesn't stop those infrastructure changes, but it forces them to be visible. When the logging pipeline changes, you update the detection logic in the same PR as the infrastructure change. You stop fixing "broken" detections reactively and start updating them as part of your standard operationalrhythm. Many teams now use Sigma as their primary language for this. You treat the Sigma rule as your "source of truth." You deploy it, and let your pipeline convert it into the specific dialect your SIEM (Splunk, Elastic, Sentinel) needs. If you ever switch SIEMs, your core logic stays safe in Git. How Does Detection-as-Code Work on Linux? Imagine you notice attackers commonly establish persistence by adding a new SSH key. You don't just hack together a query in your SIEM console. Author: You write a Sigma rule that alerts whenever ~/.ssh/authorized_keys is modified by a process other than your approved configuration management tool. You commit it to your /detections/sigma/ folder. Pull Request (PR): You open a PR. A teammate reviews it, not just for accuracy, but for potential noise. CI Validation: Your pipeline kicks off. It replays historical logs and exercises the detection using an Atomic Red Team test that emulates the targeted persistence behavior, confirming the rule doesn't trigger during normal daily backups. Merge & Deploy: Once the tests pass and a human reviewer signs off, the pipeline automatically pushes the rule to your production SIEM or runtime security tool ( Falco or Tetragon ). How Should You Organize Detection Rules? If you’re going to do this, keep it tidy. A disorganized repository is just as bad as a messy SIEM. I usually set it up like this: /security-detections ├── detections/ │ ├── sigma/ # The core logic │ └── falco/ # Runtime rules ├── tests/ │ └── mock_logs/ # Logs for validation ├── ci/ # Your CI/CD glue ├── docs/ # Explaining the "why" └── README.md Which Linux Data Sources Should You Monitor? You can’t detect what you can’t see. Relying solely on generic logs isn't going to cut it anymore. Auditd: The reliable workhorse for traditional Linux file integrity and system calls. Journald/Systemd: Use this for catching service-level persistence. If a service is created in a weird way, you’ll find it here. Sysmon for Linux : Great if you’re already used to Windows telemetry; it helps bridge the visibility gap between OSes. eBPF (Falco, Tetragon): This is the modern standard for containers and cloud-native workloads. When traditional logs disappear, eBPF sees everything happening at the kernel level. How Do You Test Detection Rules? Testing is the engine of DaC. Without it, you are just automating the deployment of broken rules. The goal is to build a "gatekeeper" in your CI/CD pipeline that validates every detection before it ever reaches production. To move beyond basic syntax checks, your pipeline should implement a multi-layered testing strategy: Replaying historical attack logs: Don't guess if a rule works—prove it. Feed recorded logs from past incidents through your rule to ensure it would have fired correctly. This is the best way to verify your detection logic against real-world adversary behavior. Validating Sigma rules: Use tools like sigma-cli to validate syntax and ensure the rules comply with your schema before they are committed. This catches typos and logic errors before they trigger a CI failure. Unit testing detections: Treat every rule like a piece of application code. Create small, "unit" test files containing only the specific log events required to trigger the rule. If the rule doesn't fire, the test fails. Regression testing: As your library grows, new rules can inadvertently interfere with old ones or create logic overlaps. Run a full suite of regression tests against your entire rule set to ensure that a change to one detection doesn't silence another. Performance testing: Heavy regex or complex sub-queries can grind a SIEM to a halt. Test your rules against a high-volume log stream in a staging environment to ensure they don't introduce unacceptable latency or consume excessive compute resources. False-positive benchmarking: Use a "known-good" set of logs—capturing routine updates, system reboots, and administrative activity—to ensure your rule remains silent on benign noise. If your rule fires during these tests, it’s not ready for production. The automation platform matters less than the workflow. Whether you use GitHub Actions, GitLab CI, Jenkins, or another system, the goal is the same: treat detection testing with the same rigor you apply to your application code. Testing Method Objective Log Replay Does it catch threats from our history? Unit Testing Do specific inputs trigger the expected output? Regression Testing Did I break any of our older rules? Performance Testing Does this query cripple our SIEM? False Positive Analysis Is it going to wake up the team for nothing? Common Detection-as-Code Mistakes to Avoid When starting with DaC, avoid these common traps: Treating Git as a backup: Nope. Git is the only place the rule lives. If it isn't in Git, it shouldn't be in your SIEM. Period. Deploying without automated testing: A rule that hasn't been tested against mock logs is a gamble, not a control. Neglecting tuning: Rules need maintenance. If a rule produces false positives, treat it like a bug and fix it in the repo. Retire obsolete rules: Detection repositories should shrink as often as they grow. If a rule is obsolete, kill it. Removing noise is as important as finding threats. Dependency blindness: Don't write a rule that depends on a log format the infra team is planning to delete next week. When Should You Use Detection-as-Code? Detection-as-Code is not a silver bullet. If you manage five rules in a lab, don't bother. The overhead of setting up a CI/CD pipeline will eat you alive. But if you’re managing hundreds of nodes, have multiple analyststouching the rules, and you're tired of alerts breaking every time someone runs an update—it’s time. The complexity is only justified as you scale. Conclusion Linux infrastructure never stays the same. Containers are rebuilt, kernels are patched, and attackers are always changing their playbook. Detection-as-Code doesn't make your rules "smarter." It makes them maintainable. And in a mature Linux environment, maintainability is the difference between a security program that actually works and a forgotten rule that stopped catching attackers six months ago. . Explore the importance of Detection-as-Code for maintaining effective security rules in a dynamic Linux environment.. Detection as Code, Linux Security, Monitoring Tools, Detection Rules, Security Practices. . Dave Wreski
 Jul 07, 2026
•
Jul 07, 2026
• How to Learn Tips and Tricks
160
 linuxsecurity considerationscontainer security
How to Check Docker Container Isolation in Linux
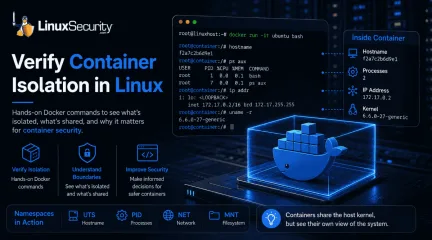
Docker makes containers feel like separate, lightweight virtual machines. They have their own hostnames, processes, and networking—but are they actually isolated? Many administrators assume they are without ever verifying the boundaries. If you’ve ever wondered what truly separates your application from the host, this guide is for you. We’ll use simple Docker commands to verify container isolation firsthand and uncover exactly what remains shared with the host. . What Is Container Isolation? Think of container isolation as a way to trick a process into thinking it has a server all to itself. If you’ve worked with virtual machines, you’re used to a hypervisor handling the heavy lifting—effectively carving out a slice of hardware. Containers are different. They don’t virtualize hardware; they use Linux namespaces to carve up the kernel’s view of the system. Basically, the kernel assigns labels to resources like network stacks or process lists. If a process in a container asks "What can I see?", the kernel only shows it the resources tagged with its specific namespace ID. It’s an illusion, sure, but it’s an incredibly effective one for keeping your applications from interfering with the host or each other. What Is Container Security? When people ask what container security is, they are usually looking for a way to keep their apps safe from start to finish. It’s not just one thing; it’s the whole process of managing your images, the runtime, and the host machine. The reason isolation is the biggest part of this is simple: if you don’t have a clear boundary, one bad script or one compromised app can easily reach into your host system. By knowing exactly what a container can (and can't) see, you can lock down your configuration and make sure that if one container fails, it doesn't take the whole server down with it. Step 1: Launch a Test Container with Docker Run To observe these boundaries, we’ll use the docker run command—the most common way to spin up a newcontainer. We are using the official Ubuntu image because it provides a familiar Linux userspace that is ideal for testing Docker commands. Run this command on your host: docker run -it ubuntu bash docker run : Creates and starts a new container instance. -it : Launches the container in interactive mode so you can run commands inside it. Once the command finishes, your terminal prompt will change. You are now working inside the container’s isolated environment. Step 2: Use Docker PS to Confirm the Container Is Running Open a second terminal window on your host and run: docker ps The output lists every active container, including its unique Container ID, image, uptime, and assigned name. Verify that your Ubuntu container appears in this list before moving to the next step. Step 3: Compare Hostnames to See Basic Isolation Let's see if the container truly has its own identity. Inside the container: Run hostname On your host: Run hostname You will see two different values. This is because the container uses the UTS (UNIX Timesharing System) namespace, which allows it to maintain a unique hostname independent of your machine. Step 4: Compare Running Processes Namespaces are at work here, too, preventing the container from seeing host-level processes. Inside the container: Run ps aux On your host: Run ps aux Inside the container, you will only see a small, clean list of processes, with bash as PID 1 because it is the first process started within that PID namespace. Meanwhile, your host terminal shows every system process. This PID namespace separation is vital for container isolation. Step 5: Use Docker Exec to Access a Running Container Administrators often need to debug a container that is already running in the background. For this, we use docker exec . Feature docker run docker exec Purpose Creates a new container Uses anexisting container State Starts a fresh environment Hooks into a running process Typical Use Initial testing/deployment Debugging or maintenance Run this on your host to jump back into your running container: docker exec -it bash Step 6: Compare Network Settings Run ip addr in both the container and the host. The container uses a separate network namespace, giving it its own virtual interfaces and a private IP address (usually in the 172.17.x.x range). This proves that the container has a private network stack, keeping its traffic separate from your host’s primary interfaces. Step 7: Compare Filesystems Create a file inside the container to test storage boundaries: touch /testfile.txt If you check your host’s current directory, you won't see this file. Although Docker stores the container's writable layer on the host, the file does not appear in your host's current working directory because the container has its own mount namespace. Step 8: See What Containers Still Share Finally, run this on both the host and the container: uname -r You will notice the kernel version is identical. This is the most critical lesson for container runtime security. Because containers share the host kernel, they do not provide the same "hard" security boundary as a virtual machine. According to official Linux kernel documentation , Linux namespaces provide logical partitioning, but they do not replace the need for secure kernel management. Common Container Isolation Mistakes Assuming Containers Are Virtual Machines: Containers are not hardware-virtualized. They are processes on your host, meaning a kernel-level exploit could impact the entire system. Running Privileged Containers: Using --privileged grants a container access to host devices, effectively bypassing many security namespaces. Using Host Networking: Using --net=host shares the host’s network namespace,removing all network isolation. Mounting Sensitive Directories: Mapping /etc or the Docker socket into a container can give the container full control over the host. Quick Reference: Observed Namespaces Namespace What You Verified UTS Different hostname PID Different process list Network Different interfaces and IP Mount Separate filesystem view Verify You've Observed Container Isolation Before you finish, ensure you’ve confirmed the following: Different hostname Different process list Different network interface Same kernel version File created inside the container is not visible in your host's working directory Container Security Best Practices To maintain a hardened environment, follow these container security best practices based on the CIS Docker Benchmark : Use Least Privilege: Never run your applications as root inside a container. Avoid Privileged Containers: Only use elevated privileges when absolutely necessary for hardware access. Keep Images Updated: Rebuild containers regularly using current base images to receive security patches and bug fixes. Patch Host Kernels: Since all containers share the host kernel, keeping your host OS updated is your primary defense against exploits. Audit Mounts: Regularly review which directories are mounted into your containers to prevent unauthorized host access. Final Takeaway You’ve now verified that containers provide effective logical isolation, but they are not the "air-gapped" environments that virtual machines are. Understanding these boundaries allows you to make informed container security decisions. Now that you’ve verified isolation firsthand, the next step is learning how Linux capabilities, cgroups, and seccomp further strengthen your environment. Exploring those features will help you move from basic containerusage to building truly resilient and secure systems. Want more Linux security news, vulnerability analysis, and software supply chain updates? Subscribe to the LinuxSecurity Newsletter and get the latest threats, advisories, and expert insights delivered directly to your inbox. . Explore how to verify Docker container isolation and understand its importance for securing Linux applications.. Docker Isolation, Container Security, Linux Best Practices. . MaK Ulac
Jul 06, 2026
•
How to Harden My Filesystem

166
 incident responselinuxsecurity analysis
How to Read Linux Audit Logs During an Intrusion
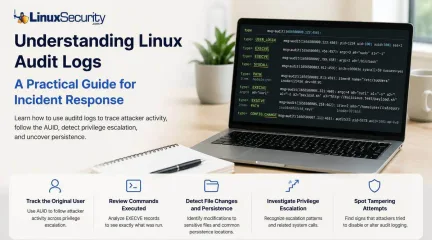
When a security alert fires, the panic often sets in before the analysis. Many administrators instinctively reach for /var/log/auth.log or journalctl , but those logs tell only a partial story. They document successful logins and authentication attempts, but they rarely capture the granular "how" of a post-compromise environment. To truly reconstruct an attack, you need to master audit logs . Unlike standard authentication logs, Linux audit logs (managed by auditd ) record system-level activity, including specific syscalls, file modifications, and command executions. In this guide, we’ll move beyond administrative documentation to show you exactly how to reconstruct an attacker’s activity during a live investigation. . Quick Incident Response Checklist Define the scope: Identify the first suspicious timestamp. Find the entry point: Search for USER_LOGIN events. Anchor the AUID: Capture the original user ID to track activity post-escalation. Trace execution: Filter EXECVE events for the auid . Audit persistence: Check for file modifications in ~/.ssh/authorized_keys or cron . Detect tampering: Inspect CONFIG_CHANGE events. Correlate: Match audit events with firewall and EDR logs. What Linux Audit Logs Reveal (The Forensic Anatomy) Before running commands, understand that auditd creates a chain of evidence. Every action (like running whoami ) generates a syscall, and every syscall is tagged with an Event ID and an auid . The auid (Audit User ID) is your "golden thread." Even if an attacker runs sudo su - to become root, their original auid remains the same. You aren't tracking a changing uid ; you are tracking the session's source. Step-by-Step: Reconstructing an Intrusion Let’s walk through a standard attack: The Compromised Session. Step A: Identify the Entry Start by searching for the login event around your alert time : Bash ausearch -m USER_LOGIN -ts 2026-06-29:02:10 -i Look for: The auid field in the output. If the auid is 1001 , every subsequent command you search for will use that specific ID. Step B: Follow the Attacker (The AUID Trail) Once you have the auid , you can ignore the uid (which will switch to 0 when they become root) and follow their specific trail: Bash ausearch -ua 1001 -i Sample Output: Plaintext type=EXECVE msg=audit(1656500000.123:456): argc=3 a0="curl" a1="-o" a2="payload.sh" ... This shows the attacker downloading a script. The auid links this activity directly to the 1001 session, even if they are currently acting as root. Step C: Identify Sensitive File Changes Attackers follow a pattern when establishing persistence or escalating. Use this table to prioritize what to investigate : File Why Attackers Target It /etc/passwd To create or alter accounts for permanent access. /etc/shadow To crack password hashes or escalate privileges. /etc/sudoers To grant themselves permanent sudo privileges. ~/.ssh/authorized_keys To maintain persistence via SSH keys. To find these, use: Bash ausearch -f /etc/sudoers -i Step D: Investigate Privilege Escalation You will often see related syscalls. When an attacker elevates privileges, look for the sequence: execve : The execution of sudo or pkexec . setuid : The transition of the effective uid to 0 . chmod / chown : Attempts to manipulate file permissions to ensure their "backdoor" remains accessible. Correlation: The Key to Context Audit logs are powerful, but they are not a standalone truth. To verify the "why," correlate them: Network Logs: If audit logs show a curl to a suspicious IP, check your firewall logs to see if that connection was successful or blocked. EDR Process Trees: Compare the pid from your audit record to your EDR telemetry to see the fullparent-child relationship of the processes. FIM (File Integrity Monitoring): If you see a file access in the audit log, verify if your FIM tool flagged the file's hash as changed. Common Investigation Mistakes Chasing the uid : Never follow the uid . It resets when an attacker uses sudo . Always stick to the auid . Missing CONFIG_CHANGE : Sophisticated attackers will run auditctl -e 0 to disable logging. If you see a gap in your logs, search ausearch -m CONFIG_CHANGE to see if the logging service was tampered with. Forgetting Timezones: Ensure your ausearch timestamps match your system's UTC or local time settings to avoid missing the window. Final Thoughts The next time an alert fires, don’t stop at the authentication logs. Audit logs can reveal every command an attacker executed, every sensitive file they touched, and every privilege escalation path they navigated. By shifting your focus from "did they log in?" to "what did they do after they logged in?", you transform audit logs from simple compliance records into a high-fidelity forensic trail. Are you ready to harden your environment? Subscribe to the LinuxSecurity Newsletter for upcoming tutorials on writing custom audit.rules and building automated detection logic for your SIEM. Related Reading Auditd vs eBPF: Effective Strategies for Modern Linux Monitoring Linux Logs Often Miss Critical Attack Details and Detection Gaps Understanding Log Management and Analysis Tools for Linux Systems Effective File Integrity Monitoring Techniques for Linux Systems Understanding Linux Persistence Mechanisms and Detection Tools Linux EDR: Essential Tool for Cybersecurity and Incident Response . Learn how to analyze Linux audit logs to uncover activity during security incidents and strengthen your incident response.. Linux Audit Logs, Incident Response, Security Analysis, Intrusion Forensics, System Activity Tracking. . MaK Ulac
Jun 29, 2026
•
How to Learn Tips and Tricks
167
 security advisoryremote accessauthentication
How to Detect Unauthorized SSH Keys on Linux Systems
Most of the time, nobody notices. SSH authentication succeeds, no alerts are generated, and the connection looks exactly the way it did the day the key was installed. That's part of the problem. . When security teams investigate unauthorized access on Linux systems, they often focus on passwords, exposed services, or vulnerable software. Trusted access receives less attention. Yet a single forgotten or unauthorized SSH key can provide the same access as a legitimate user while attracting very little scrutiny. This guide explains how to identify unauthorized SSH keys, investigate suspicious SSH activity, and determine whether the trust you've granted over time still belongs there. Why Unauthorized SSH Keys Are So Dangerous SSH keys bypass many controls that organizations traditionally depend on. A password-based attack often generates warning signs. Failed authentication attempts appear in logs. Lockout thresholds trigger. Users report suspicious activity. Security tools generate alerts. A valid SSH key behaves differently. When an attacker possesses a legitimate private key, the authentication process may look completely normal. The SSH daemon sees a trusted credential. The login succeeds. No password failures occur. No brute-force signatures appear. Nothing obviously breaks. That makes SSH keys attractive for persistence. An attacker who gains administrative access frequently adds a new public key to an existing account. Sometimes they create a new account. Sometimes they target the root directly. Other times, they hide inside a service account that rarely receives attention because administrators assume it belongs to an application. The objective is simple: maintain access after the original vulnerability gets patched. Keys also support lateral movement. Once attackers compromise one Linux host, they often search for private keys stored in home directories, automation scripts, CI/CD systems, backup repositories, or deployment servers. A single exposed private key can unlockmultiple systems. Suddenly, one foothold becomes several. The dangerous part is that none of this necessarily looks suspicious. The attacker is using a trusted authentication method exactly as it was designed to work. Where SSH Key Abuse Usually Starts Unauthorized SSH key usage rarely begins with SSH itself. The problem usually starts somewhere else in the attack chain: Developer Workstations: A compromised laptop may contain private keys used for production access. Public Repositories: Developers occasionally commit private keys, configuration files, backup archives, or deployment scripts. Automated scanning tools continuously search for exposed secrets. Service Accounts: Many organizations grant broad permissions to automation accounts because restricting access requires additional engineering work. Those accounts often hold keys that provide access across multiple environments. Vendor Access: A contractor receives temporary access to support a project. The project ends. Nobody removes the key. Months later, the account still works. Manually Added Keys: An administrator troubleshooting an outage might temporarily add a key for convenience and forget about it afterward. Step 1: Inventory Authorized SSH Keys Across Linux Systems The first step is understanding what trusted access currently exists. Many organizations cannot answer a simple question: Which SSH keys are authorized across the environment right now? Start by identifying every authorized_keys file . Most administrators immediately think about user accounts, but SSH keys appear in many places: Root accounts Service accounts Application users Automation accounts Dormant accounts Document the username, home directory, public key fingerprint, source system, key owner, business purpose, and date added, if available. This process can be tedious, but detection depends on knowing what normal looks like. If a SOC analyst discovers a public key during an investigation, the first question should be: Who owns this key? Too often, the answer is unknown. That uncertainty creates management blindness. Step 2: Compare Keys Against Known Owners Once an inventory exists, every key should be mapped to a specific owner and business purpose. A key without an owner should immediately attract attention. The same applies to keys associated with former employees, retired systems, completed projects, old vendors, or abandoned automation. Duplicate usage is another warning sign. If the same public key appears across unrelated accounts or systems, investigate why. Shared keys often emerge from convenience-based administration practices. One administrator creates a key pair and distributes it widely because it simplifies management. Convenient. Also dangerous. Compromise that one key and the attacker inherits every trust relationship attached to it. Step 3: Monitor Changes to authorized_keys Periodic audits help, but they are not enough. An attacker does not need to wait for the next quarterly review. They only need a few seconds to add a new key. Focus on locations such as: ~/.ssh/authorized_keys /root/.ssh/authorized_keys Service account SSH directories and configuration files File integrity monitoring can detect additions, removals, and modifications. Linux audit rules can also record changes and identify which process or user performed the action. Monitoring creates a timeline. A timeline reveals who changed what and when. That evidence becomes extremely valuable during incident response. Step 4: Review SSH Authentication Logs Linux authentication logs provide insight into how SSH keys are used after they are installed. Common locations include /var/log/auth.log, /var/log/secure, or journalctl. Review successful public-key authentication events rather than focusing only on failures. Several patterns warrant investigation: Logins originating from unfamiliar IP addresses. Authentication events occurring outside normal maintenance windows. Service accounts thatsuddenly begin interactive logins. Administrator accounts that have remained dormant for months and then become active again. One successful login might be legitimate. Twenty successful logins across ten servers from a previously unseen source network tell a different story. Step 5: Correlate Key Usage With User Behavior A valid key can still be used in an invalid way. Security teams should correlate SSH activity with information about users, devices, networks, and expected administrative behavior. Questions worth asking include: Did the login originate from an approved source IP? Does the user normally access systems from this network? Does the login align with the user's role and approved change tickets? Unauthorized SSH key usage often appears as a context mismatch rather than an authentication failure. The login works exactly as expected. Everything around it does not. Step 6: Look for Persistence Patterns Persistence leaves clues. Not always immediately, but attackers tend to follow recognizable patterns. Watch for a new SSH key appearing shortly after suspicious activity. High-privilege targets deserve special attention. Keys added to root accounts, infrastructure management accounts, or systems with broad sudo privileges carry elevated risk. Watch for the same key appearing across multiple hosts, as an attacker may distribute a trusted key widely. If a login is immediately followed by privilege escalation, file staging, or outbound network connections, you aren't looking at an admin—you’re looking at an adversary. Step 7: Close Audit Gaps Many SSH-related incidents are enabled by process failures rather than technical failures. Organizations often lack a centralized inventory of SSH keys. Alerting is frequently absent. A new key can be added to a production server without generating any notification. Vendor access deserves particular attention. External access is often granted quickly, but removal tends to happen much more slowly. What Security TeamsShould Alert On Security monitoring should generate alerts for: New keys added to privileged accounts Public-key logins from previously unseen source IPs Dormant users authenticating through SSH The same key appearing across unrelated accounts SSH activity outside approved maintenance windows Modifications to the SSH configuration that weaken access controls How to Respond When Abuse Is Suspected The first instinct is often to remove the key immediately. Be careful. Preserve authentication logs, shell history, audit records, and system artifacts before making changes whenever possible. Understanding how the key arrived on the system is just as important as removing it. Identify affected accounts first. Then determine which systems trust the key. Disable or remove suspicious keys only once evidence collection is complete. Rotate exposed keys. Check cron jobs, startup scripts, and scheduled tasks. Look for lateral movement because attackers rarely stop at one host when additional access is available. Prevention: Make SSH Key Trust Verifiable The strongest defense is reducing uncertainty. Every SSH key should have a documented owner, a defined purpose, and a known lifecycle. Centralized inventories help maintain that visibility. Regular reviews help remove stale access. Continuous monitoring helps identify suspicious changes before attackers can establish long-term persistence. Separate human access from service access. Treat SSH keys as privileged credentials, because that is exactly what they are. SSH keys are trusted access mechanisms, but trust alone is not a security control. Once a key is added, many organizations assume the problem is solved. Attackers benefit from that assumption. Unauthorized SSH key usage rarely resembles a brute-force attack. It rarely generates obvious authentication failures. It often looks like a successful login from a credential the system already trusts. That is why detection depends on visibility rather than simple access controls.The key that causes a future incident is often not the newest key in the environment. It is the one nobody remembered to question. Related Reading SSH Key Sprawl on Linux: Unmanaged Access Threats and Cleanup Guide Enhance Linux Server Security Through Effective SSH Best Practices Understanding Linux Persistence Mechanisms and Detection Tools . When security teams investigate unauthorized access on Linux systems, they often focus on passwords,. nobody, notices, authentication, succeeds, alerts, generated. . Dave Wreski
Jun 03, 2026
•
How to Secure My Network
166
 security advisorylinuxdocker
GitHub Actions Linux Self-Hosted Runners Security Risks 2025-30066
Self-hosted GitHub Actions runners give organizations far more flexibility than standard cloud-hosted runners. Teams can integrate internal infrastructure directly into CI/CD workflows, automate Kubernetes deployments, run custom tooling, and manage Linux-based build environments without relying entirely on external infrastructure. . That flexibility also creates a significant security risk. A compromised self-hosted GitHub Actions runner can hand attackers direct access to Kubernetes clusters, cloud credentials, package registries, and production deployment systems—often without exploiting a single Linux vulnerability. Recent compromises, such as the poisoning of the tj-actions/changed-files Action and the Codecov supply chain breach, demonstrated how attackers increasingly target CI/CD automation. This is because the pipeline itself often provides privileged access to infrastructure and production environments already. Unlike ephemeral cloud runners, self-hosted Linux runners frequently persist long after workflows complete. In many environments, they already sit close to Kubernetes clusters, internal repositories, package publishing systems, and cloud administration tooling. Why Self-Hosted GitHub Actions Runners Create Security Risks Self-hosted runners often inherit broad operational access because they handle container builds, infrastructure deployment, cloud provisioning, and release automation simultaneously. That concentration of privileged access makes the runner itself a high-value target. As workflows expanded, self-hosted runners gradually accumulated access to: cloud deployment credentials, Kubernetes environments, internal repositories, package publishing systems, infrastructure automation tooling, container registries, and production release pipelines. The risk becomes larger when organizations place runners directly inside trusted internal networks or allow workflows to interact directly with production infrastructure. Once attackerscompromise the workflow environment, the runner may become a pivot point for lateral movement deeper into the environment. Unlike traditional endpoint compromise, attackers frequently abuse legitimate CI/CD automation behavior rather than exploiting Linux directly. That operational normalcy makes malicious workflow activity much harder to detect. How to Use Ephemeral GitHub Actions Runners on Linux Persistent runners may retain credentials, temporary artifacts, shell histories, and environment variables long after workflows finish executing. That persistence creates additional opportunities for: credential theft, workflow persistence, artifact tampering, and lateral movement across infrastructure environments. Ephemeral runners reduce that exposure window because the environment is destroyed automatically after each workflow completes. If you are running on standalone Linux hosts, you can enforce this by using the --ephemeral flag during the registration process: ./config.sh --url [https://github.com/OWNER/REPO](https://github.com/OWNER/REPO) --token YOUR_TOKEN --ephemeral Many organizations now deploy ephemeral Linux runners using the GitHub Actions Runner Controller (ARC) for Kubernetes. This allows organizations to isolate workflows using namespaces, network policies, and tightly scoped service accounts. The goal is to prevent attackers from inheriting leftover state between jobs. How to Restrict Docker Socket Access on GitHub Actions Runners Exposing the Docker socket ( /var/run/docker.sock ) inside GitHub Actions workflows effectively grants root-level control over the runner host. Many Linux CI/CD environments expose this socket so pipelines can build containers directly, but that configuration becomes dangerous during workflow compromise because attackers may use Docker socket access to escape container isolation, mount sensitive host directories, or deploy privileged containers. Organizations should avoid exposing the Docker socket whenever possible.Safer alternatives include: rootless container builds, isolated build systems, BuildKit, or Kaniko. A standard Kaniko implementation in a Kubernetes-based runner looks like this: YAML - name: Build with Kaniko image: gcr.io/kaniko-project/executor:latest args: ["--dockerfile=Dockerfile", "--destination=my-registry.com/image:latest"] How to Remove Long-Lived Secrets From GitHub Actions Workflows Long-lived credentials create unnecessary exposure. Many workflow compromises specifically target GitHub Personal Access Tokens or cloud access keys stored inside repositories. Once exposed, those credentials may continue functioning long after defenders discover the breach. Organizations should replace static credentials with OIDC (OpenID Connect) . OIDC allows workflows to request temporary cloud credentials dynamically during execution. Major cloud providers, including AWS, Azure, and Google Cloud, already support OIDC integration, which significantly reduces the operational value of stolen credentials. A hardened OIDC configuration for AWS would look like this: YAML permissions: id-token: write contents: read steps: - name: Configure AWS Credentials uses: aws-actions/configure-aws-credentials@v4> with: role-to-assume: arn:aws:iam::1234567890:role/my-github-role aws-region: us-east-1 How to Restrict GitHub Actions Workflow Permissions Many GitHub Actions environments still run with broader repository permissions than workflows actually require. Overly permissive configurations, such as permissions: write-all , grant workflows unnecessary repository modification privileges. A safer baseline starts with an empty permission set, explicitly granting only the permissions required for the workflow itself: YAML permissions: {} # Grant only the specific scope required permissions: contents: read Security teams should also carefully review all workflows using the pull_request_target trigger. Because thistrigger executes using the permissions of the target repository rather than the untrusted fork, attackers may abuse it to expose repository secrets. How to Review GitHub Actions Workflow Changes Safely Workflow files should be treated like infrastructure code. Modifications inside .github/workflows/ can directly affect deployment systems, cloud authentication, and runner execution behavior. Organizations should require mandatory pull request reviews and use CODEOWNERS protection to ensure security teams audit every change. Plaintext # .github/CODEOWNERS .github/workflows/ @platform-security-team In many environments, modifying a workflow effectively changes production infrastructure behavior. Security teams should monitor for unexpected workflow additions or unauthorized permission changes that could indicate a supply chain compromise in progress. How to Restrict Outbound Traffic and Monitor Activity Many CI/CD compromises rely on transmitting secrets to attacker-controlled infrastructure. Organizations should restrict unnecessary outbound traffic from runners using firewall rules, DNS filtering, or Kubernetes NetworkPolicies . For example, you can lock down a Kubernetes runner pod to only communicate with GitHub IP ranges: YAML apiVersion: networking.k8s.io/v1 kind: NetworkPolicy metadata: name: runner-egress spec: podSelector: matchLabels: app: github-runner egress: - to: - ipBlock: cidr: 140.82.112.0/20 # GitHub IP Range Because attackers frequently operate using legitimate workflow credentials, detection often depends on identifying unusual operational behavior—such as unexpected curl execution or unauthorized cloud API activity. GitHub Actions Runner Hardening Checklist Use ephemeral runners to prevent persistence between builds. Replace long-lived cloud credentials with short-lived OIDC tokens. Remove Docker socket exposure by using Kaniko or BuildKit. Isolate runners from productionnetworks and Kubernetes control planes. Restrict outbound traffic to only essential GitHub and cloud endpoints. Enforce a "deny-all" permission baseline in every workflow YAML. Require mandatory reviews for any modification to .github/workflows/ . GitHub Actions workflows now sit directly inside the software supply chain. They build applications, publish packages, and deploy infrastructure across production systems every day. That operational position makes them extremely attractive targets. For Linux-heavy infrastructure running cloud-native workloads, the risk is significant because the pipeline is no longer just a support tool—it has become part of production itself. Want more Linux security hardening guides like this? Subscribe to our newsletter for practical tutorials on Linux infrastructure, CI/CD security, cloud-native operations, and open-source security best practices. . Self-hosted GitHub Actions runners offer flexibility but pose major security risks that organizations must address effectively.. Self-hosted GitHub, Actions runners, CI/CD security, Linux infrastructure, pipeline security. . MaK Ulac
May 15, 2026
•
How to Learn Tips and Tricks
167
 security advisoryintrusion detectionnetwork monitoring
How to Install and Set Up Snort IDS on Linux (Working Alerts in 30 Minutes)
Outcome Checklist This guide installs Snort as a passive intrusion detection system on Linux and verifies functionality by generating a test alert. Each step builds on the previous one. Do not skip steps. By the end of this guide: Snort is installed, and the version confirmed. HOME_NET is correctly configured. A local rule is created. Configuration validates without errors. A real test alert appears in /var/log/snort/alert Snort runs persistently via systemd (optional).. Identify Your OS and Network Interface Snort installation and packet capture depend on the correct operating system packages and the correct network interface. Identify both before proceeding. 0.1 Confirm Your Linux Distribution Run: cat /etc/os-release Review the values for: ID= ID_LIKE= If the system is Ubuntu or Debian-based, follow the Debian-based installation section. If the system is RHEL, Rocky, AlmaLinux, or similar, follow the RHEL-based installation section. 0.2 Identify the Active Network Interface List interfaces: ip -br link Display the routing table: ip route Identify the interface associated with the default route. Example: default via 192.168.1.1 dev eth0 In this case, eth0 is the interface that must be used with Snort. If the wrong interface is specified during execution, Snort will not capture relevant traffic. 0.3 Baseline System Note Snort depends on a stable and properly maintained Linux host. Confirm the system is updated and hardened before installation using a standard verification process, such as this guide on verifying Linux server security . Step 1: Install Snort On Linux, package installs are predictable when repositories are correctly configured and the system is current. If dependencies fail or the binary does not register, the issue is usually repository state rather than Snort itself. Install using your distribution’s native package manager. Ubuntu / Debian Refresh package metadata: sudo apt-get update Install Snort and default rule packages: sudo apt-get install -y snort snort-common snort-rules-default During installation, you may be prompted for network configuration values. These can be adjusted later in snort.conf . Confirm the binary is present and executable: snort -V which snort snort -V must return version information. which snort must return the binary path, typically /usr/sbin/snort . If the version does not print, resolve package errors before continuing. RHEL / Rocky / AlmaLinux Update repositories: sudo dnf -y update Install Snort: sudo dnf -y install snort Verify the installation: snort -V which snort snort -V must return version information. which snort must return the binary path. If the version does not print, resolve repository or package issues before proceeding. Some RHEL-based repositories install the Snort engine without bundled rule sets. This guide uses a manually created local.rules file, so additional rule downloads are not required for validation. For source-based installations or advanced deployment scenarios, refer to the official Snort installation documentation at the Snort installation guide . Step 2: Verify Snort Version (Snort 2 vs 3 Awareness) At this point, the package should be installed and the binary available in your path. Confirm the engine starts and reports a version. snort -V The command must return version information and exit cleanly. That confirms the binary executes and the required libraries are present. This guide is written for standard Snort 2.9.x package installations that use snort.conf . There is no version comparison here. You only need to confirm that Snort runs without error. If the command fails, resolve that before touching configuration files. Step 3: Confirm Important Snort Paths Linux packages do not always place files in identical locations across distributions. Before editing anything, confirm where yoursystem installed Snort components. Run: whereis snort Review the output carefully. From this, identify: Snort binary path Typically /usr/sbin/snort . This is the executable used in manual runs and systemd . Configuration file location ( snort.conf ) Often under /etc/snort/ . This is the primary configuration file you will edit. Rules directory Commonly /etc/snort/rules/ . This is where local.rules will reside. Log directory Frequently /var/log/snort/ . This is where alert output will be written. Do not assume default paths. Confirm them on your system before proceeding to configuration changes. Step 4: Prepare Required Directories and Permissions Snort writes logs, tracks state, and loads local rules from specific directories. Package installs usually create these, but verify them explicitly on your system. Create required directories if they do not exist: sudo mkdir -p /etc/snort/rules sudo mkdir -p /var/log/snort sudo mkdir -p /var/lib/snort Create a dedicated service account if it is missing: id snort 2> /dev/null || sudo useradd -r -s /usr/sbin/nologin -d /var/lib/snort snort Set ownership and restrict access: sudo chown -R snort:snort /var/log/snort /var/lib/snort sudo chmod 750 /var/log/snort /var/lib/snort Create the local rules file: sudo touch /etc/snort/rules/local.rules sudo chmod 640 /etc/snort/rules/local.rules Snort must have write access to its log directory or alerts will not be generated. Running the process as a dedicated service user prevents permanent root execution and limits system exposure. Confirm ownership before continuing. Step 5: Configure snort.conf Snort operates here as a passive intrusion detection system and requires minimal configuration changes to begin monitoring traffic. Locate the configuration file: sudo find /etc -maxdepth 4 -iname "snort.conf" Edit the file: sudo nano /etc/snort/snort.conf Ensure these linesare present and correctly defined: ipvar HOME_NET 192.168.1.0/24 ipvar EXTERNAL_NET any var RULE_PATH /etc/snort/rules include $RULE_PATH/local.rules HOME_NET must match your actual subnet. Replace 192.168.1.0/24 with your network range if different. If this system has a single public IP address, define HOME_NET using that IP with a /32 mask. Do not modify preprocessors. Do not enable inline mode. Step 6: Add a Local Test Rule At this stage Snort is installed and configured, but it has no custom logic tied to your environment. Add a controlled rule to confirm detection works. Edit the local rules file: sudo nano /etc/snort/rules/local.rules Add the following line: alert icmp any any -> $HOME_NET any (msg:"SNORT TEST - ICMP ping detected"; itype:8; sid:1000001; rev:1;) This rule generates an alert when an ICMP echo request enters HOME_NET. It is intentionally simple and designed for validation, not production monitoring. The sid value must be unique within your rule set. Do not reuse existing IDs. Rule structure, keywords, and deeper detection logic are covered separately in this guide on network intrusion detection using Snort . Save the file before moving to validation. Step 7: Validate Configuration (Mandatory) Before running Snort live, test the configuration. This prevents runtime failures caused by syntax errors or missing includes. Run: sudo snort -T -c /etc/snort/snort.conf -i INTERFACE Replace INTERFACE with your active network interface identified earlier. This command performs a configuration test only. It does not start packet inspection. If successful, you will see a message indicating configuration validation completed. Common validation failures: Incorrect RULE_PATH Missing include $RULE_PATH/local.rules HOME_NET does not match your subnet Permission errors on rule or log directories Resolve any errors before proceeding. Snort should exit cleanly with no fatal messages. Step 8: RunSnort and Generate a Real Alert Start Snort in console mode with fast alert output: sudo snort -A fast -q -c /etc/snort/snort.conf -i INTERFACE -l /var/log/snort Replace INTERFACE with your active NIC. From another host on the network, send ICMP traffic to the Snort sensor: ping -c 3 TARGET_IP Replace TARGET_IP with the IP address of the Snort system. In a separate terminal, verify log output: sudo ls -la /var/log/snort sudo tail -n 20 /var/log/snort/alert You should see an entry containing SNORT TEST - ICMP ping detected. If no alert appears, check the following: Wrong interface specified during startup HOME_NET does not match the monitored subnet local.rules not properly included in snort.conf Once the /var/log/snort/alert file exists and contains entries, alert forwarding to syslog or external dashboards can be configured separately as described in this guide on real-time alerting with Snort . Note : If testing in a cloud environment, ensure ICMP is allowed in the provider firewall or security group. Step 9: Install systemd Service for Persistence Manual execution confirms detection works. Production systems require the service to start at boot and restart automatically if it fails. Create the systemd unit file: sudo tee /etc/systemd/system/snort.service > /dev/null /dev/null || true endscript } This configuration: Rotates logs daily Retains seven days of history Compresses older logs Preserves correct ownership and permissions Reloads the Snort service after rotation Verify logrotate configuration: sudo logrotate -d /etc/logrotate.d/snort The -d flag performs a dry run and reports potential issues without modifying files. Log management should be validated periodically, especially on high-traffic sensors. Silent disk exhaustion is avoidable. Frequently Asked Questions Does this guide enable inline blocking? No. This setup runs Snort strictly as a passive intrusiondetection sensor. Inline blocking and prevention use cases are covered separately in this overview of network intrusion prevention systems . What should I do after alerts start appearing? Installation only confirms detection works. Alert triage, escalation paths, and response handling are operational decisions covered in this guide on intrusion detection response . How do I measure Snort performance? Throughput testing, packet loss analysis, and tuning methodology are separate from installation and discussed in this analysis of intrusion detection systems by the numbers . Is signature-based detection still enough? Static rule matching works, but modern detection strategies often extend beyond traditional signatures. This guide outlines broader approaches to modernizing your intrusion detection strategy . . Identify Your OS and Network Interface Snort installation and packet capture depend on the correct o. outcome, checklist, guide, installs, snort, passive, intrusion, detection, system, linux. . MaK Ulac
Feb 17, 2026
•
How to Secure My Network
161
 firewallnetworkingpacket filtering
Packet Filtering Overview in Linux Firewalls for Effective Security
A packet filtering firewall gives Linux a simple way to sort traffic at the packet level. The kernel reads the header fields, checks them against its rules, and makes a decision that stays consistent under load. The logic isn’t fancy, but it shapes how the rest of the system handles new connections. . The process is predictable. Packets arrive, their basic fields get inspected, and the filtering layer decides whether they move forward or stop right there. No payload review. No protocol deep dive. Just enough structure for the system to keep its footing. This article lays out that foundation so beginners can see how the filtering layer actually works inside Linux. Once the basic packet path is clear, the behavior of higher-level firewall tools becomes easier to understand, even when the setup remains simple. What Is Packet Filtering? Packet filtering is a basic check the system performs on every packet that reaches the kernel. A packet filtering firewall focuses on the packet header. That header is a small block of fields that the packet carries everywhere. It holds the source and destination addresses. It notes the protocol. It records the ports tied to the exchange, and that tiny set of values is enough for Linux to sort traffic quickly without reaching deeper layers. These fields give the system the minimum it needs to sort traffic. Nothing more. The idea grew out of early network equipment that had to make quick decisions with limited resources. The pattern still holds. Internet background noise shows the same thing every day. Port scans, stray connection attempts, and misrouted packets all carry enough header data for the firewall to judge them without reading the payload. The kernel leans on that predictability. The decision itself follows a straight line. The packet arrives. The header fields are compared to the rules in order. The first rule that fits determines what happens next. Some packets move forward. Some stop immediately. It is the simplest filtering model Linux uses,and it sets the base layer for everything that comes after, including more advanced stateful checks. What a Packet Looks Like A packet filtering firewall only sees what is in the packet header. Everything else is invisible at this stage. Breaking the header down makes the filtering step easier to understand. IP header fields the firewall can read: Source address Destination address Protocol value Basic routing and lifetime fields These pieces tell the kernel where the traffic came from and what type of packet it is. Nothing in this layer describes the application itself. It is all structural data that the system can trust. TCP header fields: Source and destination ports Sequence and acknowledgment numbers Flags like SYN, ACK, FIN TCP gives the firewall a sense of how a connection is forming. A SYN flag signals a new attempt. A FIN signals a close. These are simple indicators, not full context, but they help the kernel understand the packet’s place in a flow. UDP header fields: Source and destination ports Length Checksum UDP offers less information than TCP. The firewall still gets ports and protocols, which is usually enough for basic filtering, but there is no concept of connection steps. Ports in plain terms: Port 443 commonly maps to encrypted web traffic Port 22 commonly maps to SSH The firewall treats these as numbers, not guarantees Ports give a hint about the service behind the packet. The system reads them as numeric fields, and no more. Flags in plain terms: A SYN marks the start of a TCP connection An ACK signals progress in the exchange A FIN marks the close Flags help the kernel place a packet in time. They don’t reveal intent or payload, but they shape the early decision. All Linux firewall tools interpret these same fields. Interfaces differ, but the packet does not. Even early questions about choosing a Linux firewall eventually circle back to this structurebecause the filtering decision begins and ends with what the header exposes. How Linux Evaluates Packets Linux follows a steady evaluation path inside the kernel. Packets move through a small set of checkpoints, and each checkpoint gives the system a chance to make a filtering decision before the packet reaches anything higher in the stack. Packet Flow Into Netfilter Every packet hits Netfilter as soon as the kernel receives it. Netfilter assigns the packet to a chain based on direction, which keeps local traffic, outbound traffic, and transit traffic from mixing together in the filtering path. Linux Firewall Chains Explained Linux relies on three core chains for packet evaluation. INPUT checks packets headed to the local machine. OUTPUT handles packets generated by the host. FORWARD governs packets passing through the system. These chains form the backbone of Linux filtering behavior. Linux Firewall Tables Overview Rules sit inside tables, each built for a specific task. The filter table drives allow or drop decisions. NAT and other tables exist, but beginners mainly need to know that packets only touch the tables relevant to their path. The structure keeps evaluation predictable, a pattern reflected across major Linux distributions, including the Red Hat packet filtering documentation , which outlines the same table-driven model. How Netfilter Makes Decisions Netfilter processes rules in order. The kernel reads from the top of the chain, stops at the first rule that matches, and applies that result. The rest of the chain never runs. This simple flow explains why two similar rules can yield different outcomes. Why Firewall Rule Order Matters A broad rule placed early can catch traffic before a more specific rule even appears in the evaluation path. The kernel is only following its first-match logic, yet the effect can be surprising. This is where topics like firewall rule ordering basics become useful for understanding real behavior. How Packet Evaluation Fits theFiltering Model All of these decision points rely on the same header fields described earlier. The chains and tables simply give Linux a structure for reading them. Once the packet’s path is clear, the rest of the filtering model becomes easier to map, even when different firewall tools present it in their own style. Stateful Packet Filtering and Connection Tracking Stateful filtering expanded what Linux could do with packet decisions. Instead of treating every packet as a separate event, the system tracks how a connection forms and uses that memory to guide later decisions. It is a small shift in logic that changes the whole filtering model. What Stateful Packet Filtering Means Stateful packet filtering keeps a record of traffic that has already been approved. A new packet is marked as the start of a connection. Follow-up packets are marked as established. Related packets fall into a secondary category that still fits the flow. The firewall can make better judgments because it knows where the packet sits in the conversation. What Connection Tracking Actually Does Connection tracking holds a lightweight entry for each active connection. It does not store payloads or application data. It just records enough detail for the kernel to match replies to earlier packets. This keeps the evaluation orderly. Tools aimed at beginners rely on this for predictable behavior, and topics like UFW basics highlight how the heavy lifting happens behind the scenes. Why Statefulness Matters in Linux Filtering Without statefulness, the firewall would need broad rules to avoid blocking normal traffic. With it, the system sees which packets belong to a valid exchange and which do not. Established traffic moves with minimal checks. New traffic gets a closer look. It is one of the core steps that moved Linux away from older, strictly stateless models. How nftables Evaluates Packets nftables reorganized how Linux handles filtering decisions. The firewall still checks packet headers the same way, butthe path is cleaner, and the evaluation work sits closer to the packet flow. This keeps the packet filtering model consistent across tools. Key parts of the nftables model: Hooks that follow the packet path: Hooks sit at points where the kernel already processes traffic. When a packet reaches one of these points, nftables runs the rules tied to that hook. It keeps the evaluation aligned with the packet’s direction without adding extra steps. Efficient matching structures: nftables uses sets that let the kernel match addresses and ports quickly. This avoids long walks through rule lists and holds up well when traffic increases or when rulesets grow larger. Simplified filtering logic: nftables keeps decisions in fewer places. Tables map cleanly to hooks, and each rule has a focused job. The layout is easier to read and makes the evaluation path more transparent. These shifts don’t change the underlying ideas. Linux still reads the header, checks the state, and makes a decision. For someone working through the firewall troubleshooting steps , it helps to know that nftables reorganizes the filtering path without changing the core ideas. Why Packet Filtering Matters in Linux Firewalling Packet filtering matters because it gives the kernel a stable first decision on every packet, and that early verdict shapes how the rest of the firewall stack behaves. It also forms a big part of the groundwork people learn when they first look into Linux firewall basics , since most later behavior traces back to this early check. It underpins the basics of Linux firewalls. The initial allow or drop decision frames the rest of the packet’s path. Once that call is made, later components build on it rather than re-evaluating the packet from scratch. It keeps higher-level tools consistent. UFW stays predictable because the kernel already marks traffic as new or established. nftables benefits from the same foundation. Its cleaner structure still depends on the packet’s earliestevaluation inside the kernel. It shapes the troubleshooting pattern. When traffic behaves in unexpected ways, analysts often start with this first checkpoint. The decisions made here ripple through every later stage, and workflows described in firewall troubleshooting steps eventually point back to this point. It supports both inbound and outbound control. The same header checks drive decisions in both directions. Outbound filtering uses the same logic as inbound control, and concepts explored in Egress filtering continue from that shared mechanism. Packet filtering ends up as the quiet anchor that keeps Linux firewall behavior consistent, even as rule sets and tools evolve around it. Common Misunderstandings About Packet Filtering A few misunderstandings show up early when people start looking at how Linux evaluates packets. Much of it comes from expecting a packet filtering firewall to see more than it actually can or from mixing up how different layers of the system behave. Assuming the firewall inspects full payloads: Packet filtering only reads the header. The contents stay untouched at this stage. Mixing up stateless checks with stateful behavior: The firewall tracks established traffic, but not every decision comes from connection state. The distinction is easy to blur. Expecting rules to run in the wrong chain: Packets follow a specific path. If traffic never reaches a chain, its rules never apply. Thinking the firewall sees more than the header provides: The system makes its call based on fields like addresses, ports, and protocols. Anything outside that view sits out of reach. Clearing these points early keeps the filtering model steady before moving into more advanced pieces of the firewall stack. Packet Filtering Firewall FAQ A few questions come up often when people start learning how packet filtering works in Linux. Does packet filtering inspect full packets? No. It only reviews the header fields. The payload stays untouched in thisstage of the process. Is packet filtering the same as a firewall? It’s one part of a firewall. Packet filtering provides the first decision point, but higher layers build on that foundation. Do modern firewalls still use packet filtering? Yes. Even with newer designs, the header check remains the starting point for how Linux decides what to do with a packet. Where Packet Filtering Fits in Your Overall Linux Firewall Knowledge Packet filtering sits at the base of Linux firewalling, and most of the system’s behavior traces back to this early inspection step. Once the packet’s path makes sense, the rest of the firewall stack settles into a clearer shape. Rule ordering starts to feel more predictable because you understand why the kernel reaches a decision when it does. Stateful checks, which build on the same packet flow, become easier to read once you see how new and established traffic forms at the header level. Even egress control and basic troubleshooting rely on this groundwork, since every later step depends on how the packet was first classified. Nothing in the next layer is more complicated. Each concept is just an extension of the logic introduced here, and the model holds up as the ruleset grows or the network gets louder. Packet filtering ends up being the foundation that keeps everything else steady. Once this layer makes sense, the rest of the firewall stack stops feeling unpredictable. . The process is predictable. Packets arrive, their basic fields get inspected, and the filtering laye. packet, filtering, firewall, gives, linux, simple, traffic, level, kernel. . MaK Ulac
Dec 06, 2025
•
How to Secure My Firewall
167
 remote accessnetwork protocolsystem administration
Resolving SSH Connection Refused Problems for Effective Remote Access
The SSH "connection refused" error can prevent you from accessing remote machines on a network. Here's how you can troubleshoot it. . SSH is a network protocol that allows you to securely access and manage a remote system over a network. While connecting to a remote machine via SSH, you might have encountered the "connection refused" error. Experiencing this issue can be frustrating especially if you are a system admin and have to perform some tasks on the remote system on an urgent basis. Let's look at some of the possible causes of getting the SSH "connection refused" error and methods to resolve it. . To swiftly fix SSH connection refused issues, confirm the server IP, verify SSH status, and check firewall settings. Review sshd configs and network logs for further insights. SSH Connection, Remote Access, Error Resolution, Network Security, Linux Admin. . Brittany Day
Mar 03, 2023
•
How to Secure My Network

Get the latest News and Insights
Get the latest Linux and open source security news straight to your inbox.
Community Poll
Should Linux servers automatically install security updates?
Search Topics
Powered By

Linux Security - Your source for Top Linux News, Advisories, HOWTOs and Feature Releases
QUICK LINKS
subscribe to newsletters!
Like staying secure? So do we.
Sign up for updates, tips, and alerts!